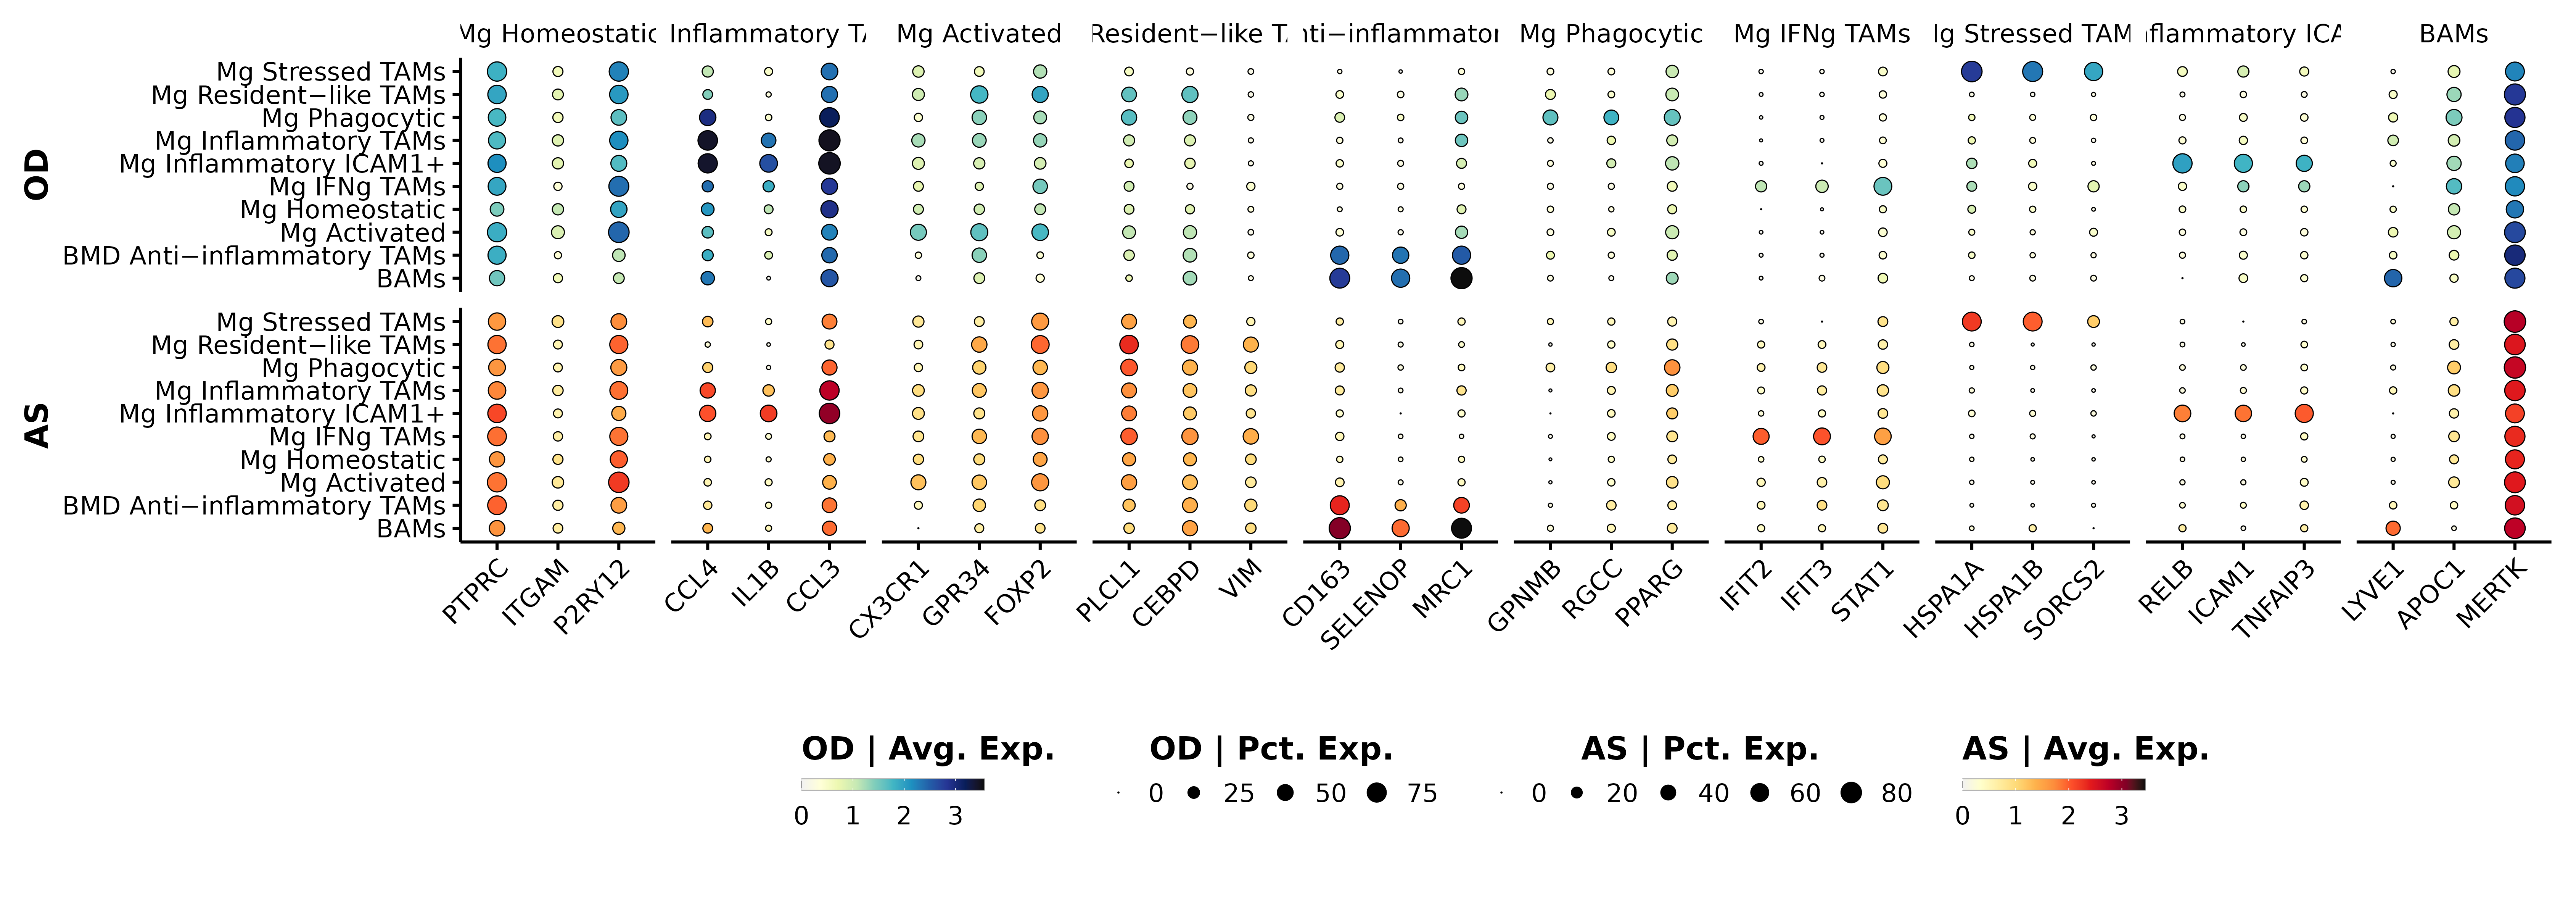
# Manually picked features from the NMF metaprograms.

features <- list("Mg Homeostatic"= c("PTPRC", "ITGAM", "P2RY12"),
                 "Mg Inflammatory TAMs" = c("CCL4", "IL1B", "CCL3"),
                 "Mg Activated"= c("CX3CR1", "GPR34", "FOXP2"),
                 "Mg Resident−like TAMs"= c("PLCL1", "CEBPD", "VIM"),
                 "BMD Anti−inflammatory TAMs"= c("CD163", "SELENOP", "MRC1"),
                 "Mg Phagocytic"= c("GPNMB", "RGCC", "PPARG"),
                 "Mg IFNg TAMs"= c("IFIT2", "IFIT3", "STAT1"),
                 "Mg Stressed TAMs"= c("HSPA1A", "HSPA1B", "SORCS2"),
                 "Mg Inflammatory ICAM1+"= c("RELB", "ICAM1", "TNFAIP3"),
                 "BAMs" = c("LYVE1", "APOC1", "MERTK"))


p1 <- SCpubr::do_DotPlot(microglia_primary[, microglia_primary$subtype == "Oligodendroglioma"],
                         features = features,
                         group.by = "final_annotation",
                         assay = "RNA",
                         legend.title = "OD | Avg. Exp.",
                         legend.length = 8,
                         legend.width = 0.5,
                         legend.framecolor = "grey50",
                         legend.tickcolor = "white",
                         legend.framewidth = 0.2,
                         legend.tickwidth = 0.2,
                         font.size = 20,
                         axis.text.face = "plain") +
      ggplot2::ylab("OD") +
      ggplot2::theme(axis.text.x.bottom = ggplot2::element_blank(),
                     axis.ticks.x.bottom = ggplot2::element_blank(),
                     axis.line.x.bottom = ggplot2::element_blank(),
                     strip.background = ggplot2::element_blank(),
                     strip.text.x.top = ggplot2::element_text(face = "plain"),
                     plot.margin = ggplot2::margin(t = 0, r = 10, b = 5, l = 10))

p2 <- SCpubr::do_DotPlot(microglia_primary[, microglia_primary$subtype == "Astrocytoma"],
                         features = features,
                         group.by = "final_annotation",
                         assay = "RNA",
                         sequential.palette = "YlOrRd",
                         legend.title = "AS | Avg. Exp.",
                         legend.length = 8,
                         legend.width = 0.5,
                         legend.framecolor = "grey50",
                         legend.tickcolor = "white",
                         legend.framewidth = 0.2,
                         legend.tickwidth = 0.2,
                         font.size = 20,
                         axis.text.face = "plain") +
      ggplot2::ylab("AS") +
      ggplot2::theme(strip.background = ggplot2::element_blank(),
                     strip.text.x.top = ggplot2::element_blank(),
                     plot.margin = ggplot2::margin(t = 0, r = 10, b = 0, l = 10))

p1$guides$size$title <- "OD | Pct. Exp."
p2$guides$size$title <- "AS | Pct. Exp."

p <- patchwork::wrap_plots(A = p1,
                           B = p2,
                           C = patchwork::guide_area(),
                           design = "A
                                     B
                                     C",
                           guides = "collect") +
     patchwork::plot_annotation(theme = ggplot2::theme(legend.position = "bottom"))