# Enrique Blanco Carmona
# e.blancocarmona@kitz-heidelberg.de
# PhD Student – Clinical Bioinformatics
# Division of Pediatric Neurooncology (B062)
# DKFZ-KiTZ | Germany
# Read in metadata.
metadata <- as.data.frame(readxl::read_excel("/omics/odcf/analysis/OE0145_projects/idh_gliomas/Figures_Science/revision/IDH_gliomas_book/datasets/paired_samples_metadata.xlsx"))
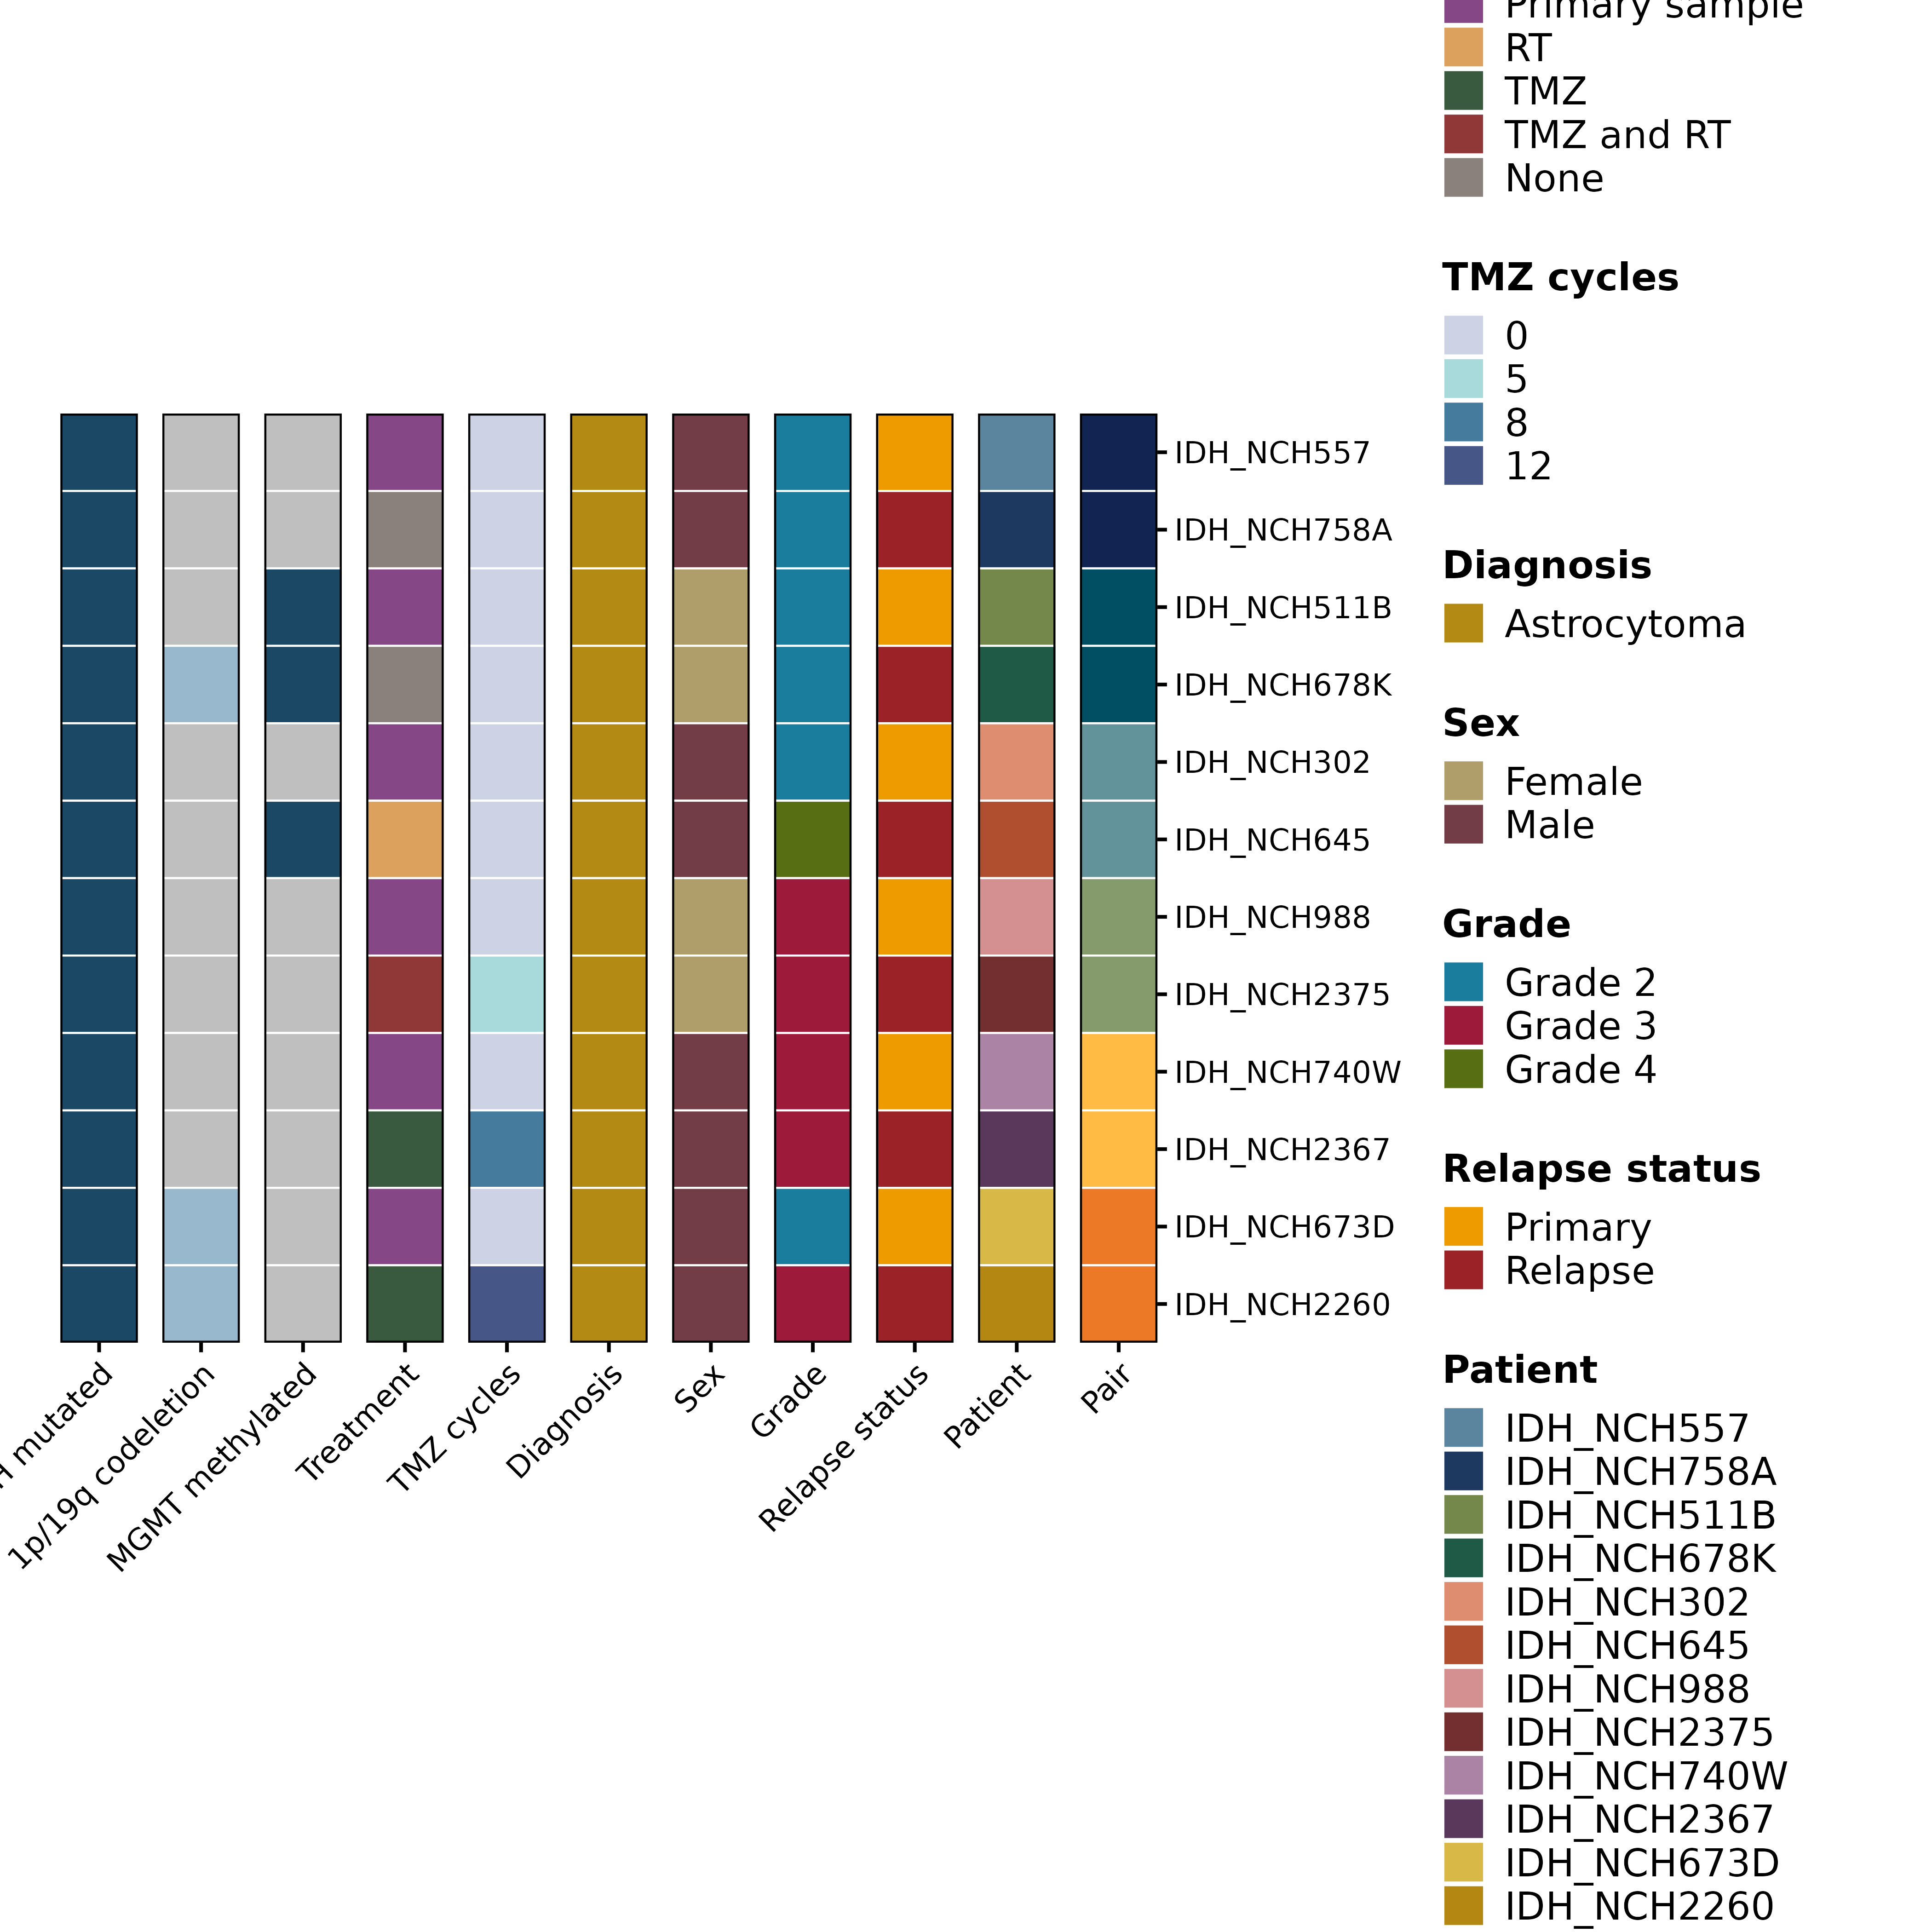
# Define colors.
yes_no_colors <- c("Yes" = "#1b4965",
"No" = "#98b9cd")
colors.use <- list("IDH mutated" = yes_no_colors,
"1p/19q codeletion" = yes_no_colors,
"MGMT methylated" = yes_no_colors,
"Treatment" = c("Primary sample" = "#854785",
"None" = "#8a817c",
"RT" = "#dda15e",
"TMZ" = "#3a5a40",
"TMZ and RT" = "#903738"),
"TMZ cycles" = c("0" = "#cdd3e5",
"5" = "#a8dadc",
"8" = "#457b9d",
"12" = "#465686"),
"Diagnosis" = c("Oligodendroglioma" = "#3c5b8b",
"Astrocytoma" = "#b38b14",
"sGBM" = "#14b363"),
"Sex" = c("Male" = "#723d46",
"Female" = "#af9d6a"),
"Grade" = c("Grade 2" = "#1a7d9e",
"Grade 3" = "#9e1a3b",
"Grade 4" = "#576e12"),
"Relapse status" = c("Primary" = "#ee9b00",
"Relapse" = "#9b2226"),
"Patient" = c("IDH_NCH557" = "#5b859e",
"IDH_NCH758A" = "#1e395f",
"IDH_NCH511B" = "#75884b",
"IDH_NCH678K" = "#1e5a46",
"IDH_NCH302" = "#df8d71",
"IDH_NCH645" = "#af4f2f",
"IDH_NCH988" = "#d48f90",
"IDH_NCH2375" = "#732f30",
"IDH_NCH740W" = "#ab84a5",
"IDH_NCH2367" = "#59385c",
"IDH_NCH673D" = "#d8b847",
"IDH_NCH2260" = "#b38711"),
"Pair" = c("6" = "#eb7926",
"5" = "#ffbb44",
"4" = "#859b6c",
"3" = "#62929a",
"2" = "#004f63",
"1" = "#122451"))
# Process metadata.
rownames(metadata) <- metadata$Samples
metadata$Samples <- NULL
metadata <- metadata %>%
dplyr::mutate_all(.funs = function(x){ifelse(x == "NA", NA, x)}) %>%
dplyr::select(dplyr::all_of(c(names(colors.use), "Pair"))) %>%
dplyr::mutate("IDH mutated" = factor(.data$`IDH mutated`, levels = c("Yes", "No")),
"1p/19q codeletion" = factor(.data$`1p/19q codeletion`, levels = c("Yes", "No")),
"MGMT methylated" = factor(.data$`MGMT methylated`, levels = c("Yes", "No")),
"Treatment" = factor(.data$Treatment, levels = c("Primary sample", "RT", "TMZ", "TMZ and RT", "None")),
"TMZ cycles" = factor(.data$`TMZ cycles`, levels = c("0", "5", "8", "12")),
"Diagnosis" = factor(.data$Diagnosis, levels = c("Astrocytoma", "sGBM")),
"Sex" = factor(.data$Sex, levels = c("Female", "Male")),
"Grade" = factor(.data$Grade, levels = c("Grade 2", "Grade 3", "Grade 4")),
"Relapse status" = factor(.data$`Relapse status`, levels = c("Primary", "Relapse")),
"Patient" = factor(.data$Patient, levels = c("IDH_NCH557",
"IDH_NCH758A",
"IDH_NCH511B",
"IDH_NCH678K",
"IDH_NCH302" ,
"IDH_NCH645" ,
"IDH_NCH988" ,
"IDH_NCH2375",
"IDH_NCH740W",
"IDH_NCH2367",
"IDH_NCH673D",
"IDH_NCH2260")),
"Pair" = factor(.data$Pair, levels = c("1", "2", "3", "4", "5", "6"))) %>%
as.data.frame()
rownames(metadata) <- metadata$Patient
# Plot.
p <- SCpubr::do_MetadataPlot(from_df = TRUE,
df = metadata,
legend.ncol = 1,
colors.use = colors.use,
axis.text.face = "plain",
font.size = 20,
legend.font.size = 20,
legend.symbol.size = 8,
cluster = FALSE,
legend.position = "right") &
ggplot2::ylab("")
p <- p + patchwork::plot_annotation(theme = ggplot2::theme(plot.margin = ggplot2::margin(t = 0, r = 40, l = 0, b = 0)))