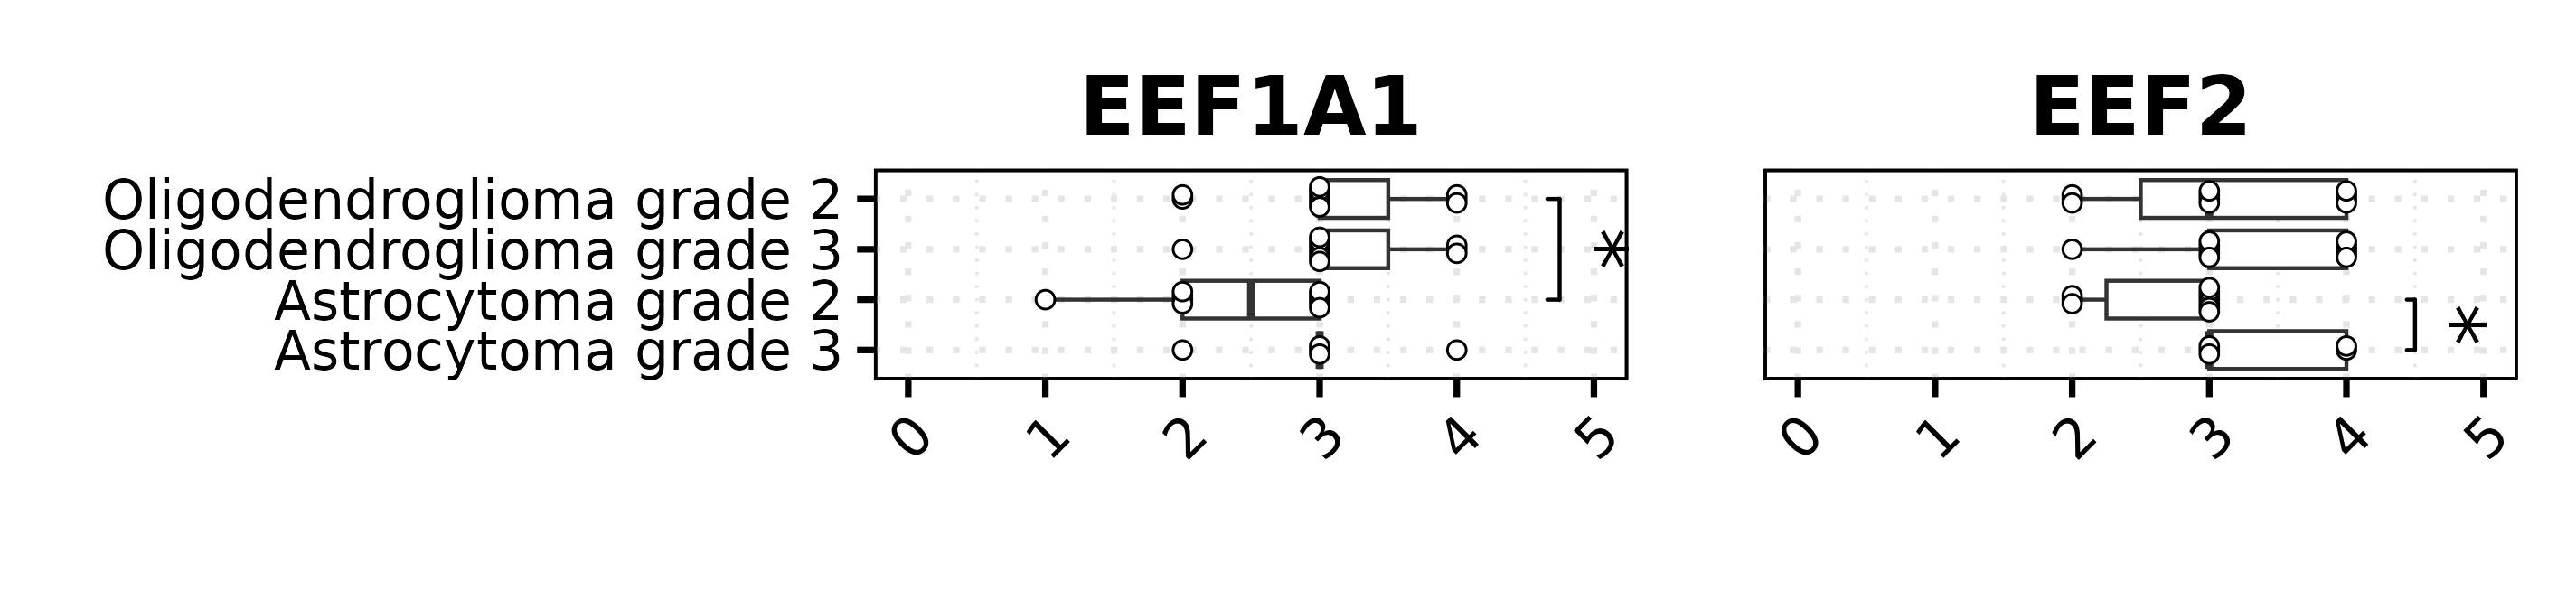
p1 <- data[data$Marker == "EEF1A1", ] %>%
      ggplot2::ggplot(mapping = ggplot2::aes(y = forcats::fct_rev(.data$Type),
                                             x = .data$Score)) +
      ggplot2::geom_boxplot(na.rm = TRUE)  +
      ggbeeswarm::geom_beeswarm(size = 2,
                                color = "black",
                                fill = "white",
                                shape = 21,
                                stroke = 0.5,
                                cex = 2,
                                na.rm = TRUE) +
      ggsignif::geom_signif(test = "wilcox.test",
                            comparisons = list(c("Oligodendroglioma grade 2", "Astrocytoma grade 2")),
                            map_signif_level = TRUE,
                            margin_top = 0.25,
                            na.rm = TRUE,
                            size = 0.5,
                            textsize = 8) +
      ggplot2::labs(y = "",
                    x = "",
                    title = "EEF1A1") +
      ggplot2::theme_minimal(base_size = 18) +
      ggplot2::scale_x_continuous(limits = c(0, 5)) +
      ggplot2::theme(plot.title = ggplot2::element_text(face = "bold",
                                                        hjust = 0.5,
                                                        vjust = 0),
                     plot.subtitle = ggplot2::element_text(face = "bold", hjust = 0),
                     plot.caption = ggplot2::element_text(face = "plain", hjust = 1),
                     legend.text = ggplot2::element_text(face = "plain"),
                     legend.title = ggplot2::element_text(face = "bold"),
                     plot.title.position = "panel",
                     plot.caption.position = "plot",
                     text = ggplot2::element_text(family = "sans"),
                     legend.justification = "center",
                     legend.position = "bottom",
                     axis.title.x = ggplot2::element_text(color = "black", face = "bold", hjust = 0.5),
                     axis.title.y.left = ggplot2::element_text(color = "black", face = "bold", angle = 90),
                     axis.title.y.right = ggplot2::element_blank(),
                     axis.text.y.left = ggplot2::element_text(color = "black",
                                                               face = "plain"),
                     axis.text.y.right = ggplot2::element_blank(),
                     axis.ticks.x.bottom = ggplot2::element_line(color = "black"),
                     axis.ticks.y.right = ggplot2::element_blank(),
                     axis.ticks.y.left = ggplot2::element_line(color = "black"),
                     axis.text.x.bottom = ggplot2::element_text(color = "black",
                                                         face = "plain",
                                                         angle = SCpubr:::get_axis_parameters(angle = 45, flip = TRUE)[["angle"]],
                                                         hjust = SCpubr:::get_axis_parameters(angle = 45, flip = TRUE)[["hjust"]],
                                                         vjust = SCpubr:::get_axis_parameters(angle = 45, flip = TRUE)[["vjust"]]),
                     strip.text.x = ggplot2::element_text(face = "bold",
                                                          color = "black"),
                     strip.text.y = ggplot2::element_blank(),
                     panel.border = ggplot2::element_rect(color = "black", fill = NA),
                     panel.grid = ggplot2::element_line(color = "grey90", linetype = "dotted"),
                     plot.margin = ggplot2::margin(t = 10, r = 10, b = 10, l = 0),
                     plot.background = ggplot2::element_rect(fill = "white", color = "white"),
                     panel.background = ggplot2::element_rect(fill = "white", color = "black", linetype = "solid"),
                     legend.background = ggplot2::element_rect(fill = "white", color = "white"))


p2 <- data[data$Marker == "EEF2", ] %>%
      ggplot2::ggplot(mapping = ggplot2::aes(y = forcats::fct_rev(.data$Type),
                                             x = .data$Score)) +
      ggplot2::geom_boxplot(na.rm = TRUE)  +
      ggbeeswarm::geom_beeswarm(size = 2,
                                color = "black",
                                fill = "white",
                                shape = 21,
                                stroke = 0.5,
                                cex = 2,
                                na.rm = TRUE) +
      ggsignif::geom_signif(test = "wilcox.test",
                            comparisons = list(c("Astrocytoma grade 2", "Astrocytoma grade 3")),
                            map_signif_level = TRUE,
                            margin_top = 0.25,
                            na.rm = TRUE,
                            size = 0.5,
                            textsize = 8) +
      ggplot2::labs(y = "", x = "", title = "EEF2") +
      ggplot2::theme_minimal(base_size = 18) +
      ggplot2::scale_x_continuous(limits = c(0, 5)) +
      ggplot2::theme(plot.title = ggplot2::element_text(face = "bold",
                                                        hjust = 0.5,
                                                        vjust = 0),
                     plot.subtitle = ggplot2::element_text(face = "bold", hjust = 0),
                     plot.caption = ggplot2::element_text(face = "plain", hjust = 1),
                     legend.text = ggplot2::element_text(face = "plain"),
                     legend.title = ggplot2::element_text(face = "bold"),
                     plot.title.position = "panel",
                     plot.caption.position = "plot",
                     text = ggplot2::element_text(family = "sans"),
                     legend.justification = "center",
                     legend.position = "bottom",
                     axis.title.x = ggplot2::element_text(color = "black", face = "bold", hjust = 0.5),
                     axis.title.y.left = ggplot2::element_text(color = "black", face = "bold", angle = 90),
                     axis.title.y.right = ggplot2::element_blank(),
                     axis.text.y.left = ggplot2::element_blank(),
                     axis.text.y.right = ggplot2::element_blank(),
                     axis.ticks.x.bottom = ggplot2::element_line(color = "black"),
                     axis.ticks.y.right = ggplot2::element_blank(),
                     axis.ticks.y.left = ggplot2::element_blank(),
                     axis.text.x.bottom = ggplot2::element_text(color = "black",
                                                         face = "plain",
                                                         angle = SCpubr:::get_axis_parameters(angle = 45, flip = TRUE)[["angle"]],
                                                         hjust = SCpubr:::get_axis_parameters(angle = 45, flip = TRUE)[["hjust"]],
                                                         vjust = SCpubr:::get_axis_parameters(angle = 45, flip = TRUE)[["vjust"]]),
                     strip.text.x = ggplot2::element_text(face = "bold",
                                                          color = "black"),
                     strip.text.y = ggplot2::element_blank(),
                     panel.border = ggplot2::element_rect(color = "black", fill = NA),
                     panel.grid = ggplot2::element_line(color = "grey90", linetype = "dotted"),
                     plot.margin = ggplot2::margin(t = 10, r = 10, b = 10, l = 0),
                     plot.background = ggplot2::element_rect(fill = "white", color = "white"),
                     panel.background = ggplot2::element_rect(fill = "white", color = "black", linetype = "solid"),
                     legend.background = ggplot2::element_rect(fill = "white", color = "white"))

p <- patchwork::wrap_plots(A = p1,
                           B = p2,
                           design = "AB")