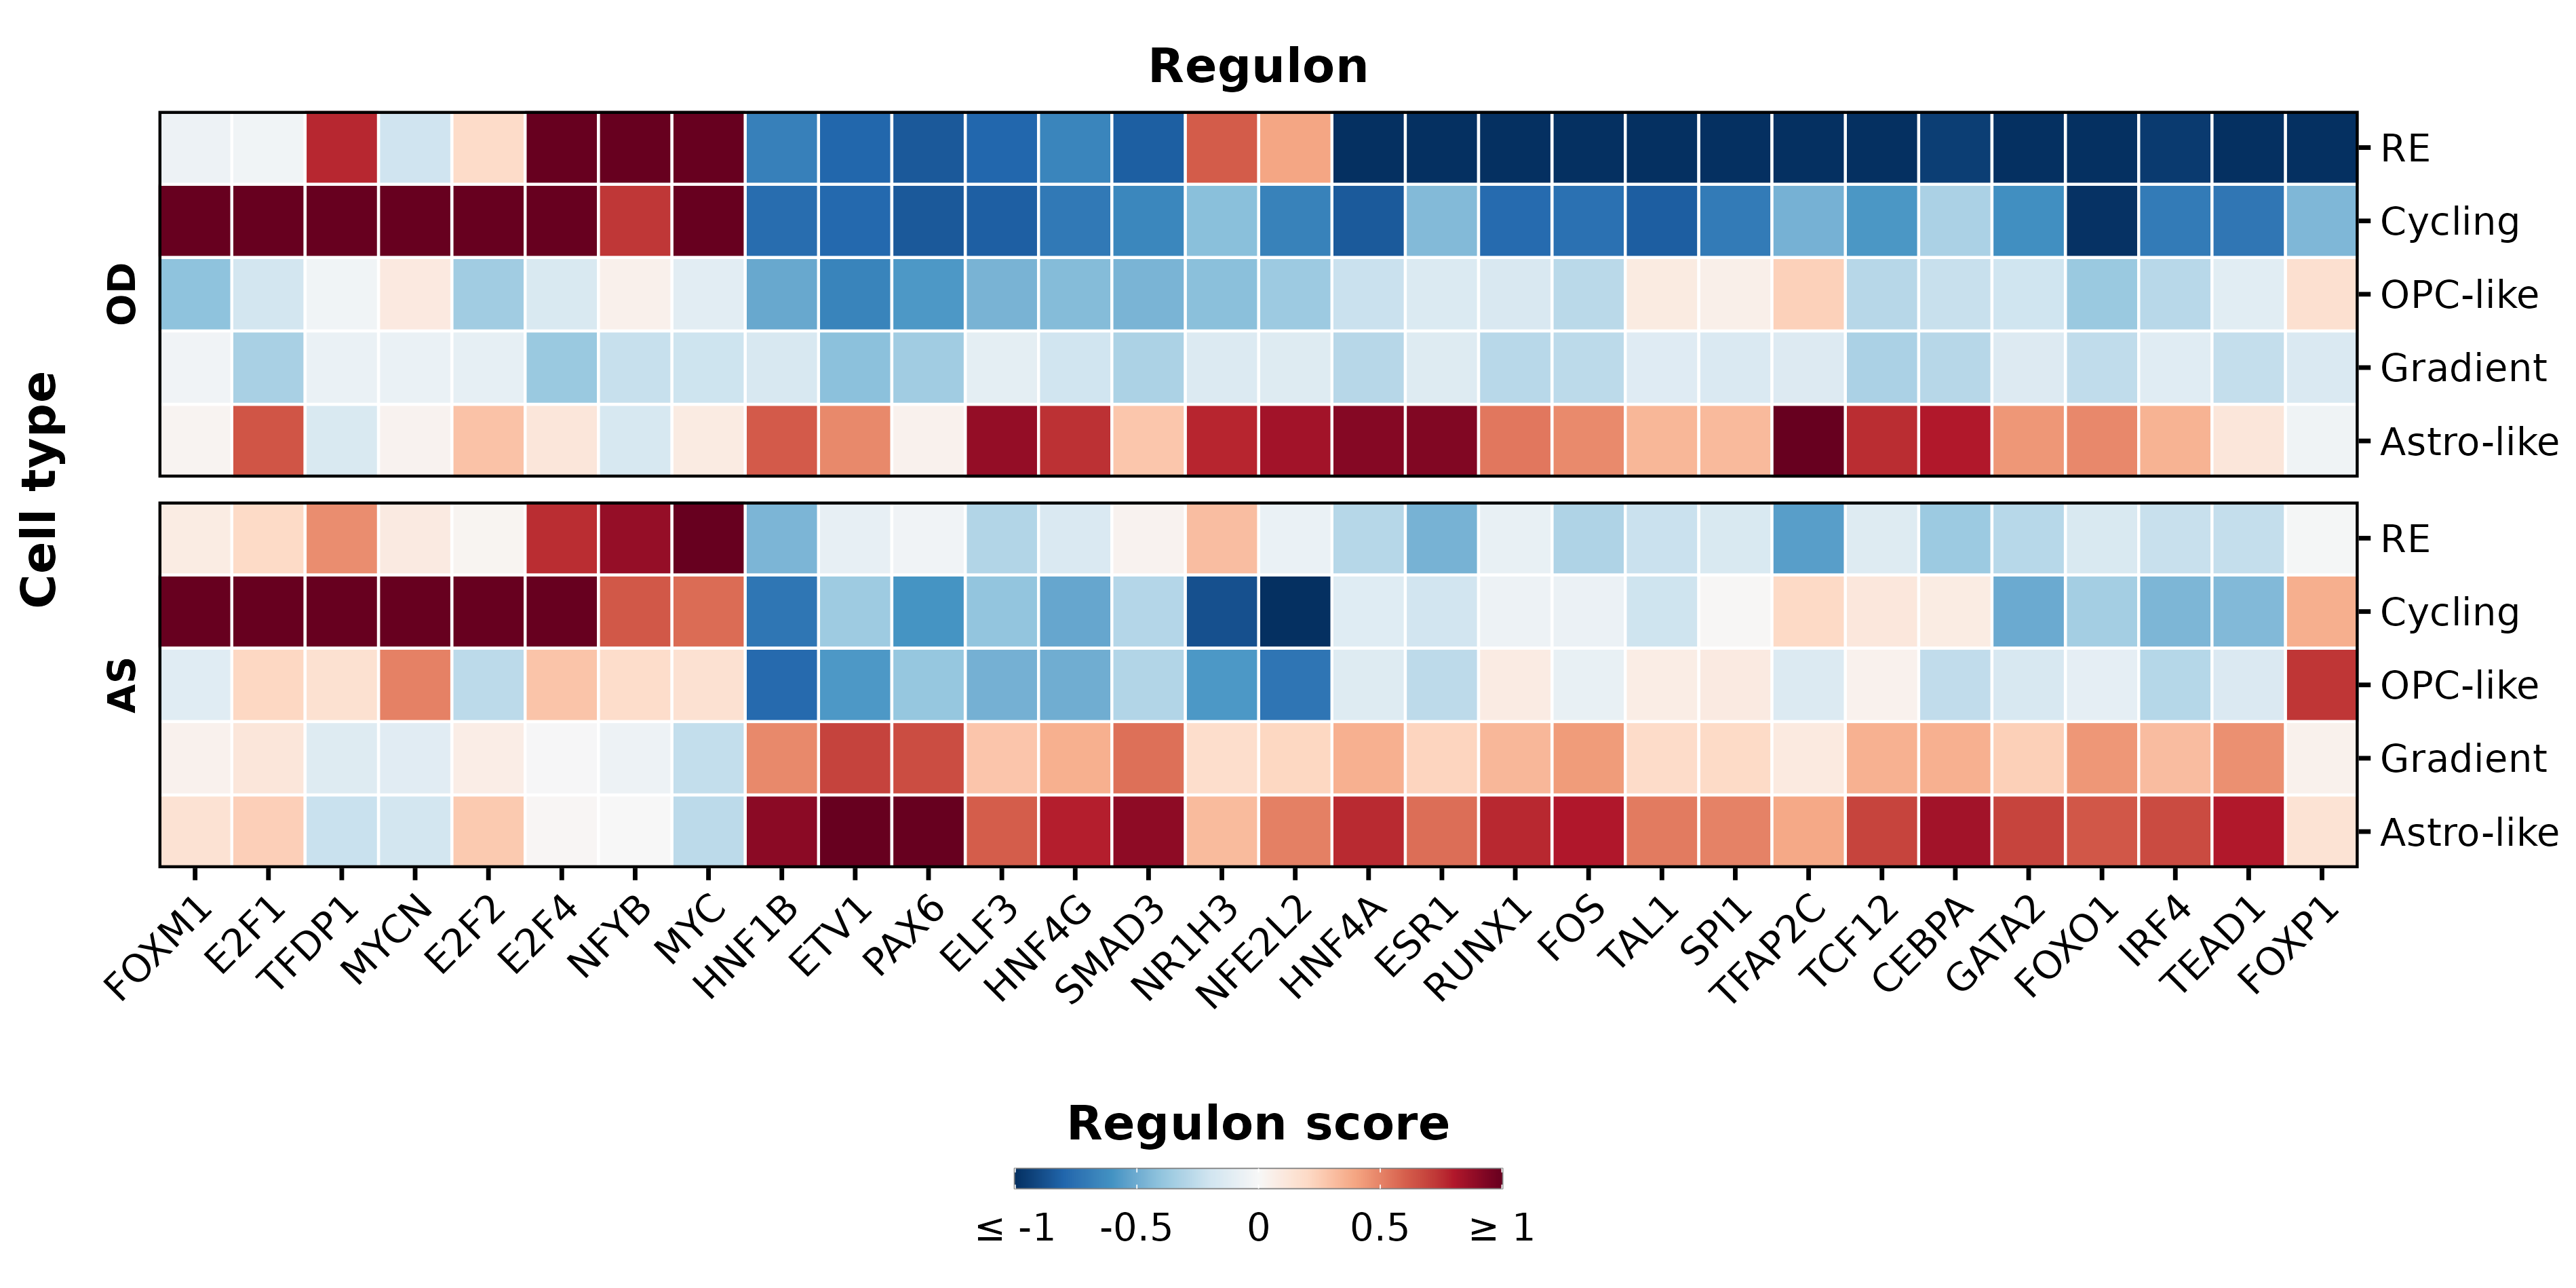
p <- SCpubr::do_TFActivityPlot(sample = sample,
                               activities = dorothea_activities,
                               n_tfs = 30,
                               split.by = "subtype",
                               group.by = c("relabelling"),
                               max.cutoff = 1,
                               min.cutoff = -1,
                               font.size = 17,
                               axis.text.face = "plain",
                               legend.length = 12,
                               legend.width = 0.5,
                               legend.framecolor = "grey50",
                               legend.tickcolor = "white",
                               legend.framewidth = 0.2,
                               legend.tickwidth = 0.2) +
     ggplot2::xlab("Regulon") +
     ggplot2::ylab("Cell type")

p$guides$fill$title <- "Regulon score"
p <- p + ggplot2::theme(plot.margin = ggplot2::margin(t = 0, r = 0, b = 0, l = 0))
