Figure 3B

Code
# Enrique Blanco Carmona
# e.blancocarmona@kitz-heidelberg.de
# PhD Student – Clinical Bioinformatics
# Division of Pediatric Neurooncology (B062)

# Read in sample.
sample <- readRDS("/omics/odcf/analysis/OE0145_projects/idh_gliomas/Figures_Science/revision/IDH_gliomas_book/datasets/microglia_primary.rds")

# Define colors.
cluster_cols <- c("Mg Homeostatic"= "#ECA809",                          
                  "Mg Inflammatory TAMs" = "#043362",                  
                  "Mg Activated"= "#9A031E",                 
                  "Mg Resident−like TAMs"= "#009FF5",                    
                  "BMD Anti−inflammatory TAMs"= "#BC5210",            
                  "Mg Phagocytic"= "#279185",                 
                  "Mg IFNg TAMs"= "#7EB356",                   
                  "Mg Stressed TAMs"= "#AC70FF",                  
                  "Mg Inflammatory ICAM1+"= "#63412C",                  
                  "BAMs" = "#5F0F40")
Code
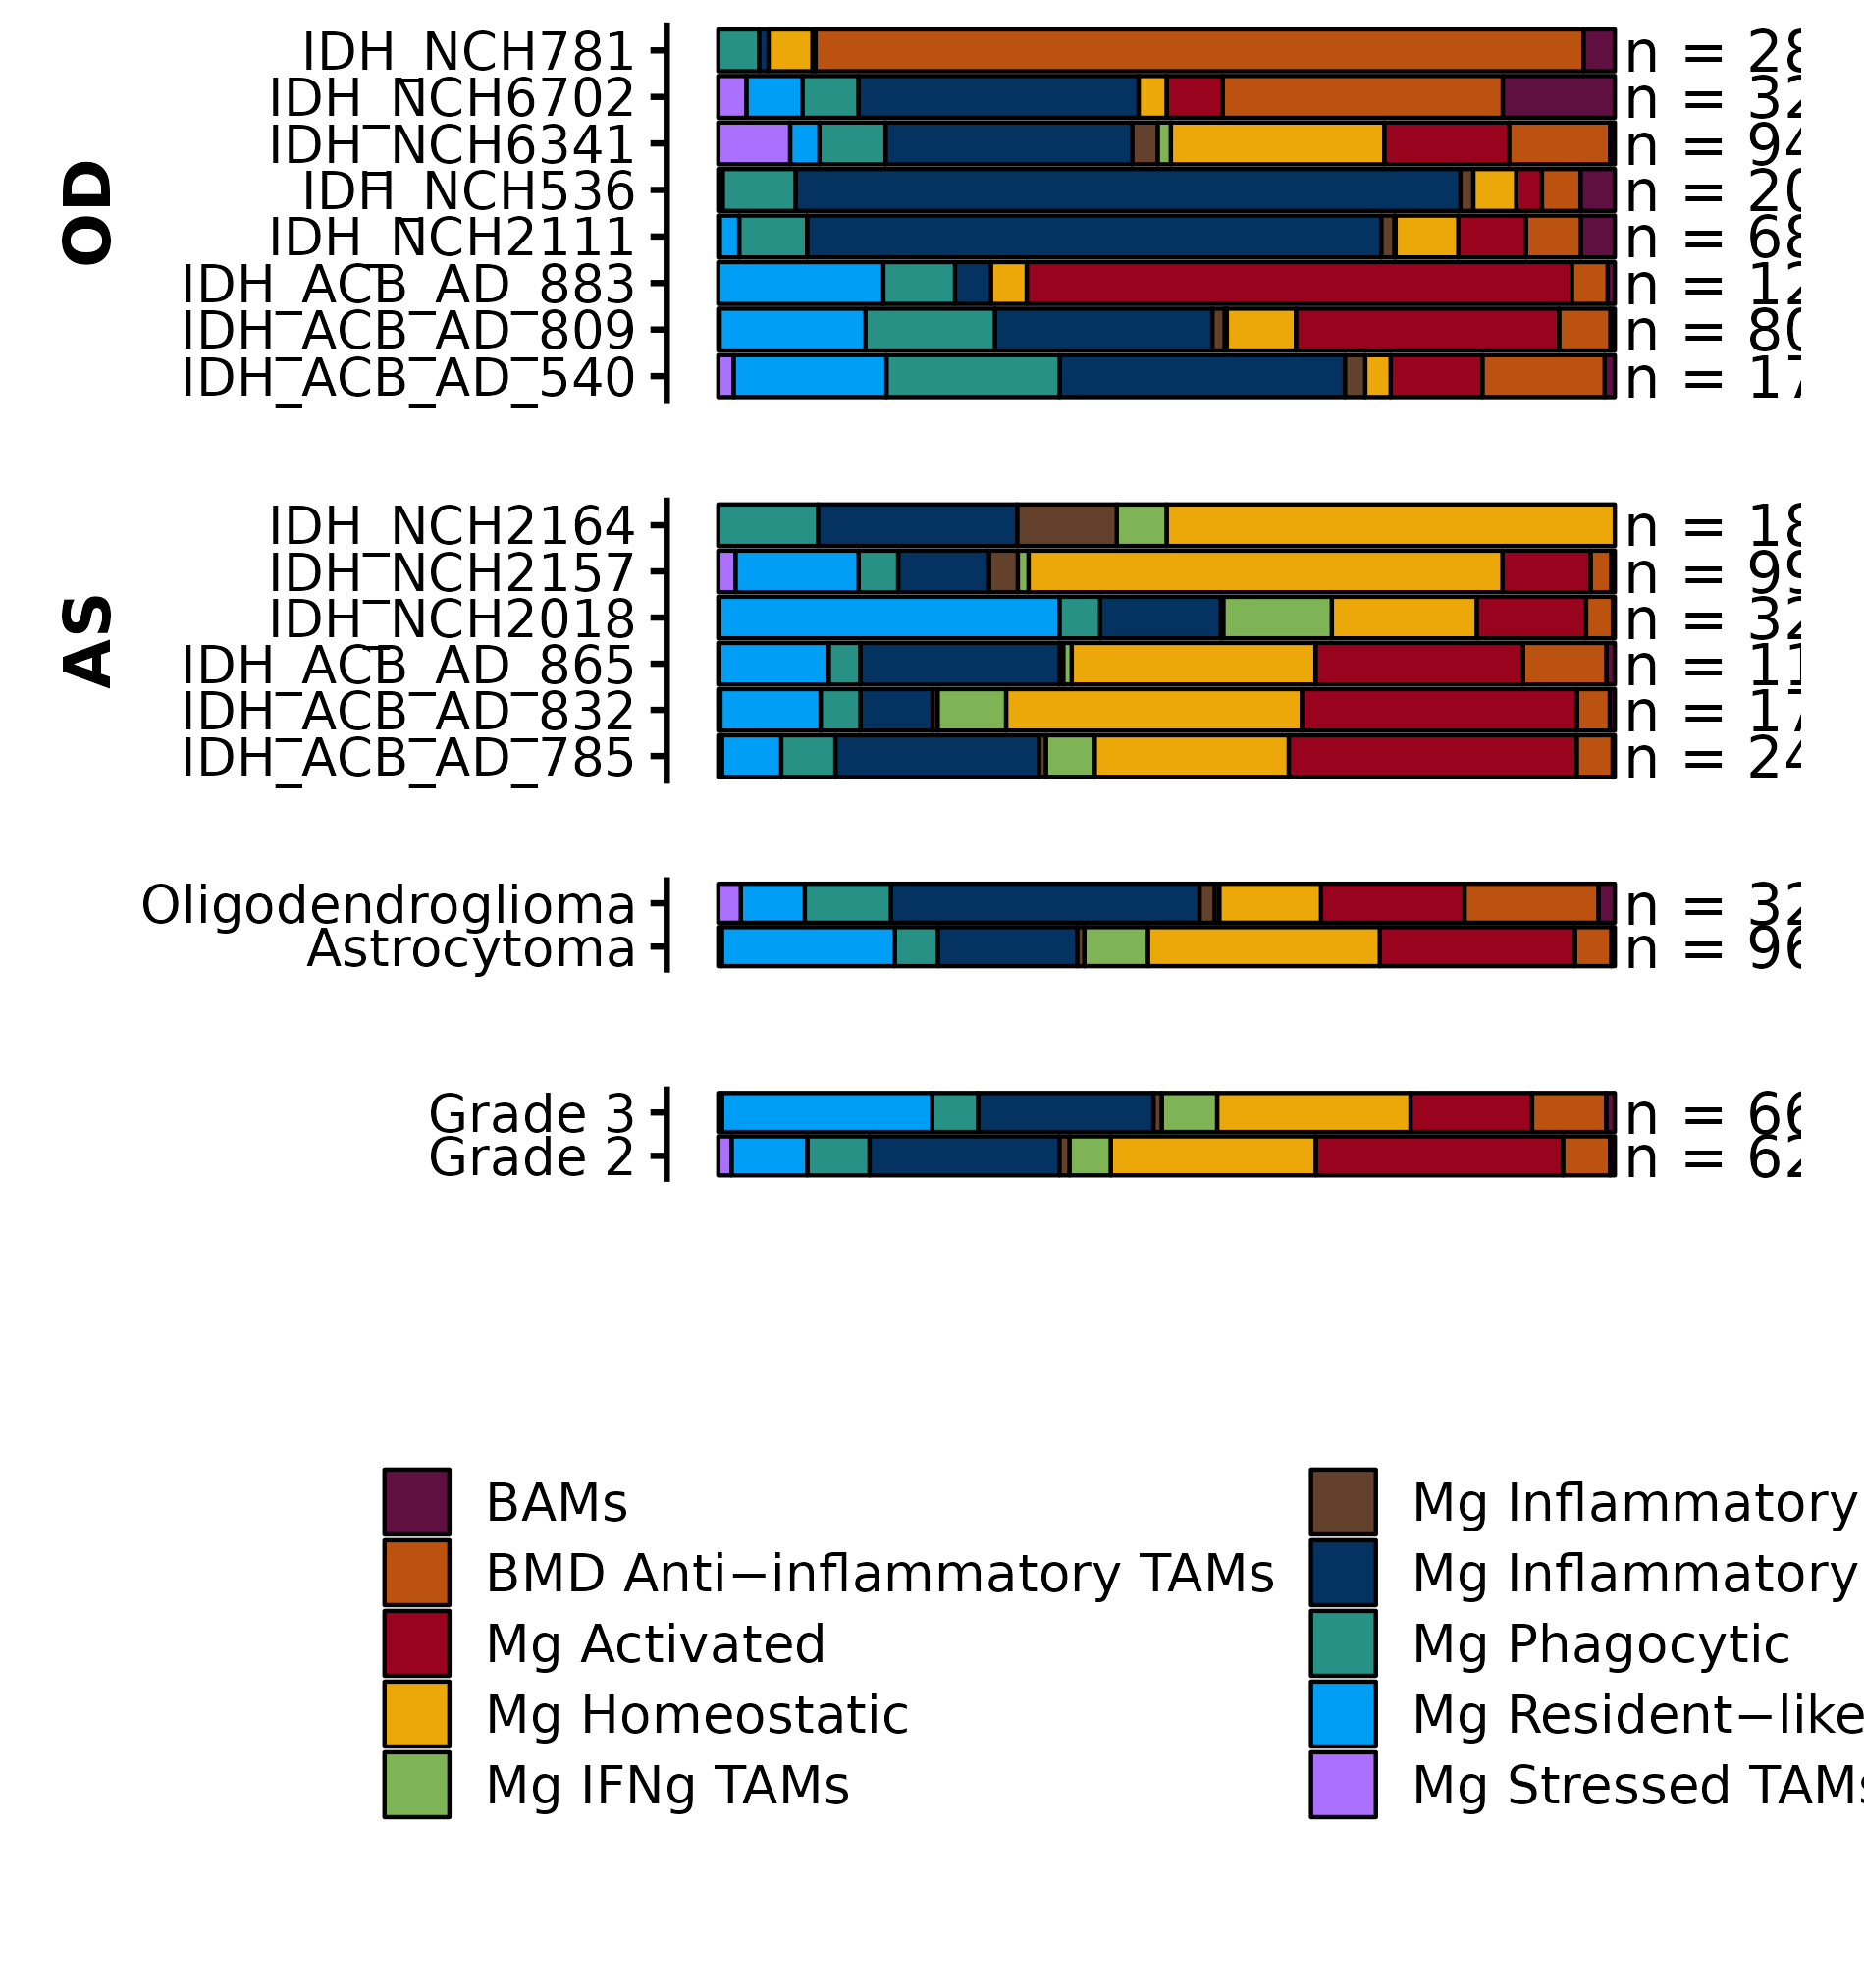
p0 <- SCpubr::do_BarPlot(sample = sample[, sample$subtype == "Oligodendroglioma"],
                         group.by = "final_annotation",
                         split.by = "orig.ident",
                         font.size = 16,
                         flip = TRUE,
                         colors.use = cluster_cols,
                         position = "fill",
                         legend.position = "none",
                         plot.grid = FALSE,
                         add.n = TRUE,
                         add.n.expand = c(0, 1.15),
                         axis.text.face = "plain",
                         add.n.size = 5) +
      ggplot2::ylab("") +
      ggplot2::xlab("OD") + 
      ggplot2::theme(axis.text.x = ggplot2::element_blank(),
                     axis.ticks.x = ggplot2::element_blank(),
                     strip.text = ggplot2::element_blank(),
                     plot.margin = ggplot2::margin(t = 0, r = 10, b = 0, l = 10))

p1 <- SCpubr::do_BarPlot(sample = sample[, sample$subtype == "Astrocytoma"],
                         group.by = "final_annotation",
                         split.by = "orig.ident",
                         font.size = 16,
                         flip = TRUE,
                         colors.use = cluster_cols,
                         position = "fill",
                         legend.position = "none",
                         plot.grid = FALSE,
                         add.n = TRUE,
                         add.n.expand = c(0, 1.15),
                         axis.text.face = "plain",
                         add.n.size = 5) +
      ggplot2::ylab("") +
      ggplot2::xlab("AS") + 
      ggplot2::theme(axis.text.x = ggplot2::element_blank(),
                     axis.ticks.x = ggplot2::element_blank(),
                     strip.text = ggplot2::element_blank(),
                     plot.margin = ggplot2::margin(t = 0, r = 10, b = 0, l = 10))

p2 <- SCpubr::do_BarPlot(sample = sample,
                         group.by = "final_annotation",
                         split.by = "subtype",
                         flip = TRUE,
                         position = "fill",
                         font.size = 16,
                         colors.use = cluster_cols,
                         legend.position = "none",
                         plot.grid = FALSE,
                         add.n = TRUE,
                         add.n.expand = c(0, 1.15),
                         axis.text.face = "plain",
                         add.n.size = 5) +
      ggplot2::xlab("") +
      ggplot2::ylab("") +
      ggplot2::theme(axis.text.x.bottom = ggplot2::element_blank(),
                     axis.ticks.x.bottom = ggplot2::element_blank(),
                     axis.line.x.bottom = ggplot2::element_blank(),
                     strip.background = ggplot2::element_blank(),
                     plot.margin = ggplot2::margin(t = 0, r = 10, b = 5, l = 10))

p3 <- SCpubr::do_BarPlot(sample = sample,
                         group.by = "final_annotation",
                         split.by = "grade",
                         flip = TRUE,
                         position = "fill",
                         font.size = 16,
                         colors.use = cluster_cols,
                         plot.grid = FALSE,
                         add.n = TRUE,
                         add.n.expand = c(0, 1.15),
                         axis.text.face = "plain",
                         add.n.size = 5,
                         legend.ncol = 2,
                         legend.title = "") +
      ggplot2::xlab("") +
      ggplot2::ylab("") +
      ggplot2::theme(axis.text.x.bottom = ggplot2::element_blank(),
                     axis.ticks.x.bottom = ggplot2::element_blank(),
                     axis.line.x.bottom = ggplot2::element_blank(),
                     strip.background = ggplot2::element_blank(),
                     plot.margin = ggplot2::margin(t = 0, r = 10, b = 5, l = 10))

layout <- paste(c(rep("A", 8), rep("B", 6), rep("C", 2), rep("D", 2), "E"), collapse = "\n")

p <- patchwork::wrap_plots(A = p0,
                           B = p1,
                           C = p2,
                           D = p3,
                           E = patchwork::guide_area(),
                           design = layout)