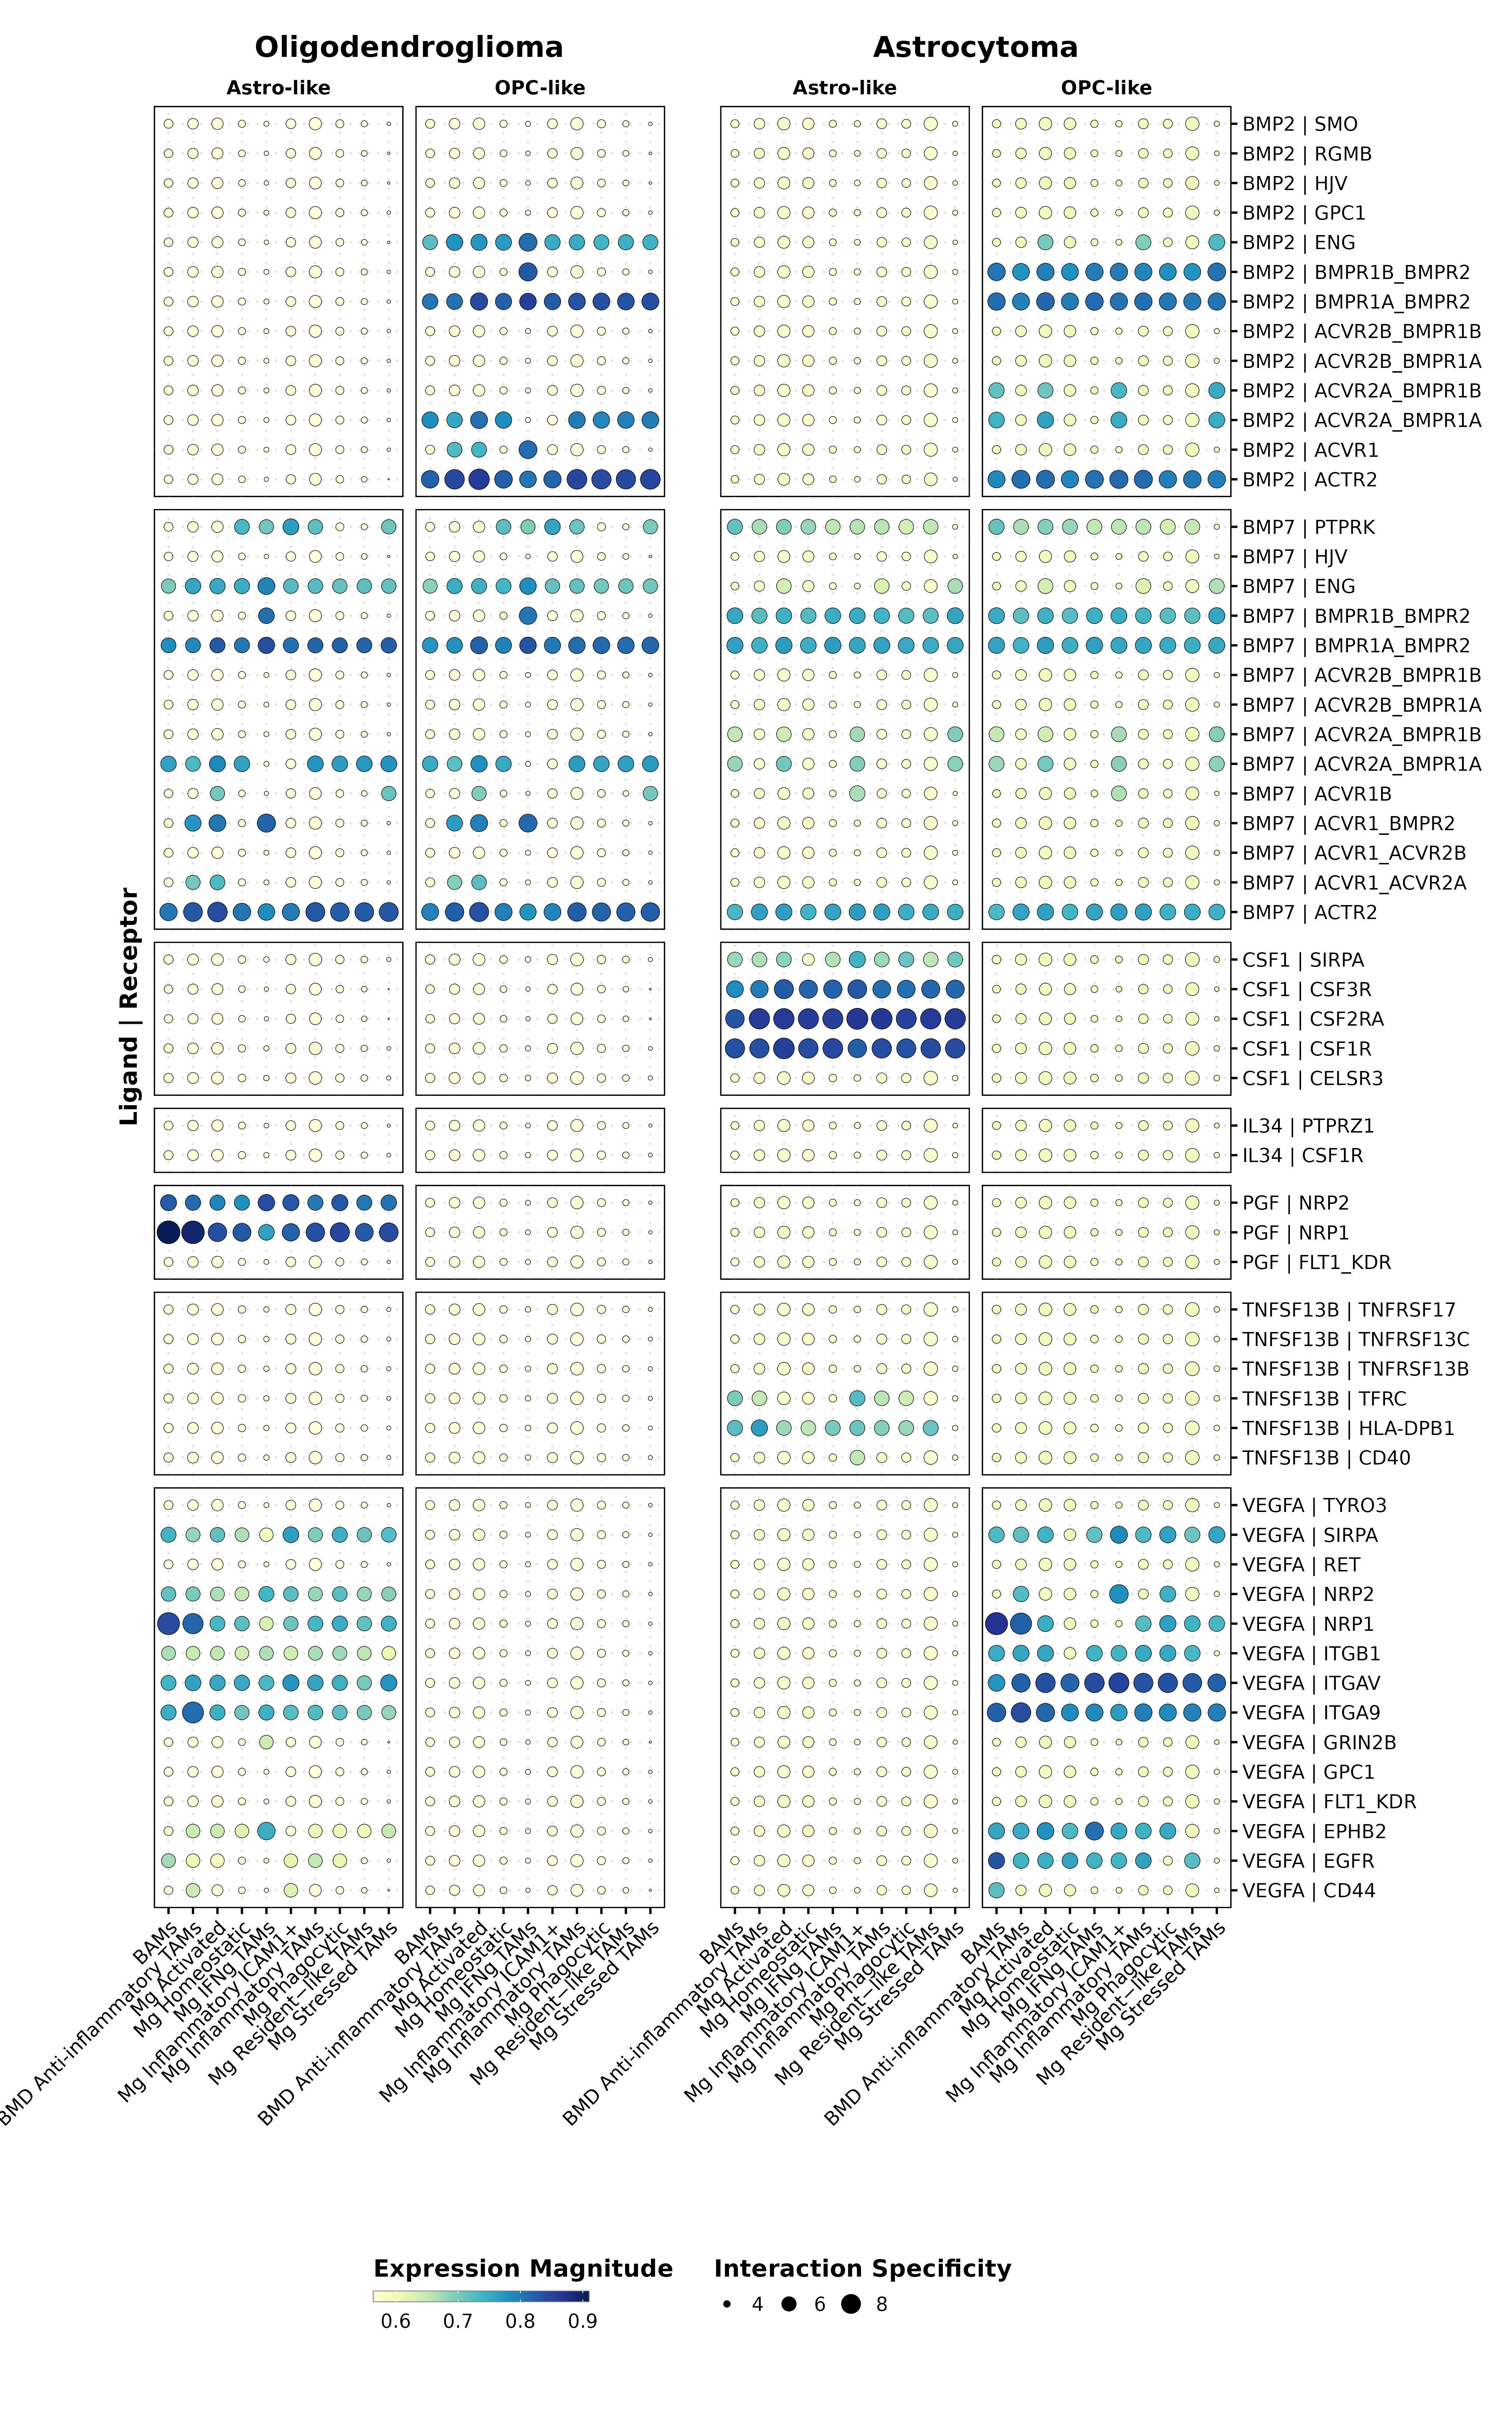
magnitude_limits <- c(min(c(min(liana_OD$sca.LRscore, na.rm = TRUE),
min(liana_AS$sca.LRscore, na.rm = TRUE))),
max(c(max(liana_OD$sca.LRscore, na.rm = TRUE),
max(liana_AS$sca.LRscore, na.rm = TRUE))))
specificity_limits <- c(min(c(min(liana_OD$aggregate_rank_inv, na.rm = TRUE),
min(liana_AS$aggregate_rank_inv, na.rm = TRUE))),
max(c(max(liana_OD$aggregate_rank_inv, na.rm = TRUE),
max(liana_AS$aggregate_rank_inv, na.rm = TRUE))))
scale.magnitude <- SCpubr:::compute_scales(sample = NULL,
feature = NULL,
assay = NULL,
reduction = NULL,
slot = NULL,
number.breaks = 5,
min.cutoff = NA,
max.cutoff = NA,
flavor = "Seurat",
enforce_symmetry = FALSE,
from_data = TRUE,
limits.use = magnitude_limits)
scale.specificity <- SCpubr:::compute_scales(sample = NULL,
feature = NULL,
assay = NULL,
reduction = NULL,
slot = NULL,
number.breaks = 5,
min.cutoff = NA,
max.cutoff = NA,
flavor = "Seurat",
enforce_symmetry = FALSE,
from_data = TRUE,
limits.use = specificity_limits)
p1 <- liana_OD %>%
ggplot2::ggplot(mapping = ggplot2::aes(x = .data$target,
y = .data$interaction,
fill = .data$sca.LRscore,
size = .data$aggregate_rank_inv,
group = .data$target)) +
ggplot2::geom_point(shape = 21, na.rm = TRUE, stroke = 0.25) +
ggplot2::guides(y.sec = SCpubr:::guide_axis_label_trans(~paste0(levels(.data$interaction)))) +
ggplot2::scale_size_continuous(name = "Interaction Specificity",
range = c(0.25, 7),
breaks = scale.specificity$breaks,
labels = scale.specificity$labels,
limits = scale.specificity$limits) +
ggplot2::scale_fill_gradientn(colors = RColorBrewer::brewer.pal(n = 9, name = "YlGnBu")[1:9],
na.value = NA,
name = "Expression Magnitude",
breaks = scale.magnitude$breaks,
labels = scale.magnitude$labels,
limits = scale.magnitude$limits) +
ggplot2::facet_grid(.data$ligand.complex ~ .data$source,
space = "free",
scales = "free",
drop = FALSE) +
ggplot2::ggtitle("Oligodendroglioma") +
ggplot2::xlab("") +
ggplot2::ylab("Ligand | Receptor") +
ggplot2::guides(size = ggplot2::guide_legend(title.position = "top",
title.hjust = 0.5,
override.aes = ggplot2::aes(fill = "black"))) +
ggplot2::theme_minimal(base_size = 16) +
ggplot2::theme(plot.title = ggplot2::element_text(face = "bold",
hjust = 0.5,
vjust = 0),
plot.subtitle = ggplot2::element_text(face = "bold", hjust = 0),
plot.caption = ggplot2::element_text(face = "plain", hjust = 1),
legend.text = ggplot2::element_text(face = "plain"),
legend.title = ggplot2::element_text(face = "bold"),
plot.title.position = "panel",
plot.caption.position = "plot",
text = ggplot2::element_text(family = "sans"),
legend.justification = "center",
legend.position = "bottom",
axis.title.x = ggplot2::element_text(color = "black", face = "bold", hjust = 0.5),
axis.title.y.left = ggplot2::element_text(color = "black", face = "bold", angle = 90),
axis.title.y.right = ggplot2::element_blank(),
axis.text.y.right = ggplot2::element_blank(),
axis.text.y.left = ggplot2::element_blank(),
axis.ticks.x = ggplot2::element_line(color = "black"),
axis.ticks.y.left = ggplot2::element_blank(),
axis.ticks.y.right = ggplot2::element_blank(),
axis.text.x = ggplot2::element_text(color = "black",
face = "plain",
angle = SCpubr:::get_axis_parameters(angle = 45, flip = FALSE)[["angle"]],
hjust = SCpubr:::get_axis_parameters(angle = 45, flip = FALSE)[["hjust"]],
vjust = SCpubr:::get_axis_parameters(angle = 45, flip = FALSE)[["vjust"]]),
strip.text.x = ggplot2::element_text(face = "bold",
color = "black"),
strip.text.y = ggplot2::element_blank(),
panel.border = ggplot2::element_rect(color = "black", fill = NA),
panel.grid = ggplot2::element_line(color = "grey90", linetype = "dotted"),
plot.margin = ggplot2::margin(t = 10, r = 10, b = 10, l = 40),
plot.background = ggplot2::element_rect(fill = "white", color = "white"),
panel.background = ggplot2::element_rect(fill = "white", color = "black", linetype = "solid"),
legend.background = ggplot2::element_rect(fill = "white", color = "white"))
p1 <- SCpubr:::modify_continuous_legend(p = p1,
legend.aes = "fill",
legend.type = "colorbar",
legend.position = "bottom",
legend.length = 10,
legend.width = 0.5,
legend.framecolor = "grey50",
legend.tickcolor = "white",
legend.framewidth = 0.25,
legend.tickwidth = 0.25)
p2 <- liana_AS %>%
ggplot2::ggplot(mapping = ggplot2::aes(x = .data$target,
y = .data$interaction,
fill = .data$sca.LRscore,
size = .data$aggregate_rank_inv,
group = .data$target)) +
ggplot2::geom_point(shape = 21, na.rm = TRUE, stroke = 0.25) +
ggplot2::guides(y.sec = SCpubr:::guide_axis_label_trans(~paste0(levels(.data$interaction)))) +
ggplot2::scale_size_continuous(name = "Interaction Specificity",
range = c(0.25, 7),
breaks = scale.specificity$breaks,
labels = scale.specificity$labels,
limits = scale.specificity$limits) +
ggplot2::scale_fill_gradientn(colors = RColorBrewer::brewer.pal(n = 9, name = "YlGnBu")[1:9],
na.value = NA,
name = "Expression Magnitude",
breaks = scale.magnitude$breaks,
labels = scale.magnitude$labels,
limits = scale.magnitude$limits) +
ggplot2::facet_grid(.data$ligand.complex ~ .data$source,
space = "free",
scales = "free",
drop = FALSE) +
ggplot2::ggtitle("Astrocytoma") +
ggplot2::xlab("") +
ggplot2::ylab("") +
ggplot2::guides(size = ggplot2::guide_legend(title.position = "top",
title.hjust = 0.5,
override.aes = ggplot2::aes(fill = "black"))) +
ggplot2::theme_minimal(base_size = 16) +
ggplot2::theme(plot.title = ggplot2::element_text(face = "bold",
hjust = 0.5,
vjust = 0),
plot.subtitle = ggplot2::element_text(face = "bold", hjust = 0),
plot.caption = ggplot2::element_text(face = "plain", hjust = 1),
legend.text = ggplot2::element_text(face = "plain"),
legend.title = ggplot2::element_text(face = "bold"),
plot.title.position = "panel",
plot.caption.position = "plot",
text = ggplot2::element_text(family = "sans"),
legend.justification = "center",
legend.position = "bottom",
axis.title.x = ggplot2::element_text(color = "black", face = "bold", hjust = 0.5),
axis.title.y.left = ggplot2::element_text(color = "black", face = "bold", angle = 90),
axis.title.y.right = ggplot2::element_blank(),
axis.text.y.right = ggplot2::element_text(color = "black",
face = "plain"),
axis.text.y.left = ggplot2::element_blank(),
axis.ticks.x = ggplot2::element_line(color = "black"),
axis.ticks.y.left = ggplot2::element_blank(),
axis.ticks.y.right = ggplot2::element_line(color = "black"),
axis.text.x = ggplot2::element_text(color = "black",
face = "plain",
angle = SCpubr:::get_axis_parameters(angle = 45, flip = FALSE)[["angle"]],
hjust = SCpubr:::get_axis_parameters(angle = 45, flip = FALSE)[["hjust"]],
vjust = SCpubr:::get_axis_parameters(angle = 45, flip = FALSE)[["vjust"]]),
strip.text.x = ggplot2::element_text(face = "bold",
color = "black"),
strip.text.y = ggplot2::element_blank(),
panel.border = ggplot2::element_rect(color = "black", fill = NA),
panel.grid = ggplot2::element_line(color = "grey90", linetype = "dotted"),
plot.margin = ggplot2::margin(t = 10, r = 10, b = 10, l = 0),
plot.background = ggplot2::element_rect(fill = "white", color = "white"),
panel.background = ggplot2::element_rect(fill = "white", color = "black", linetype = "solid"),
legend.background = ggplot2::element_rect(fill = "white", color = "white"))
p2 <- SCpubr:::modify_continuous_legend(p = p2,
legend.aes = "fill",
legend.type = "colorbar",
legend.position = "bottom",
legend.length = 10,
legend.width = 0.5,
legend.framecolor = "grey50",
legend.tickcolor = "white",
legend.framewidth = 0.25,
legend.tickwidth = 0.25)
p <- patchwork::wrap_plots(A = p1,
B = p2,
C = patchwork::guide_area(),
design = "AAAAAAAABBBBBBBB
AAAAAAAABBBBBBBB
AAAAAAAABBBBBBBB
AAAAAAAABBBBBBBB
AAAAAAAABBBBBBBB
AAAAAAAABBBBBBBB
AAAAAAAABBBBBBBB
AAAAAAAABBBBBBBB
CCCCCCCCCCCCCCCC",
guides = "collect") +
patchwork::plot_annotation(theme = ggplot2::theme(legend.position = "bottom",
plot.margin = ggplot2::margin(t = 10, r = 10, b = 10, l = 40)))
