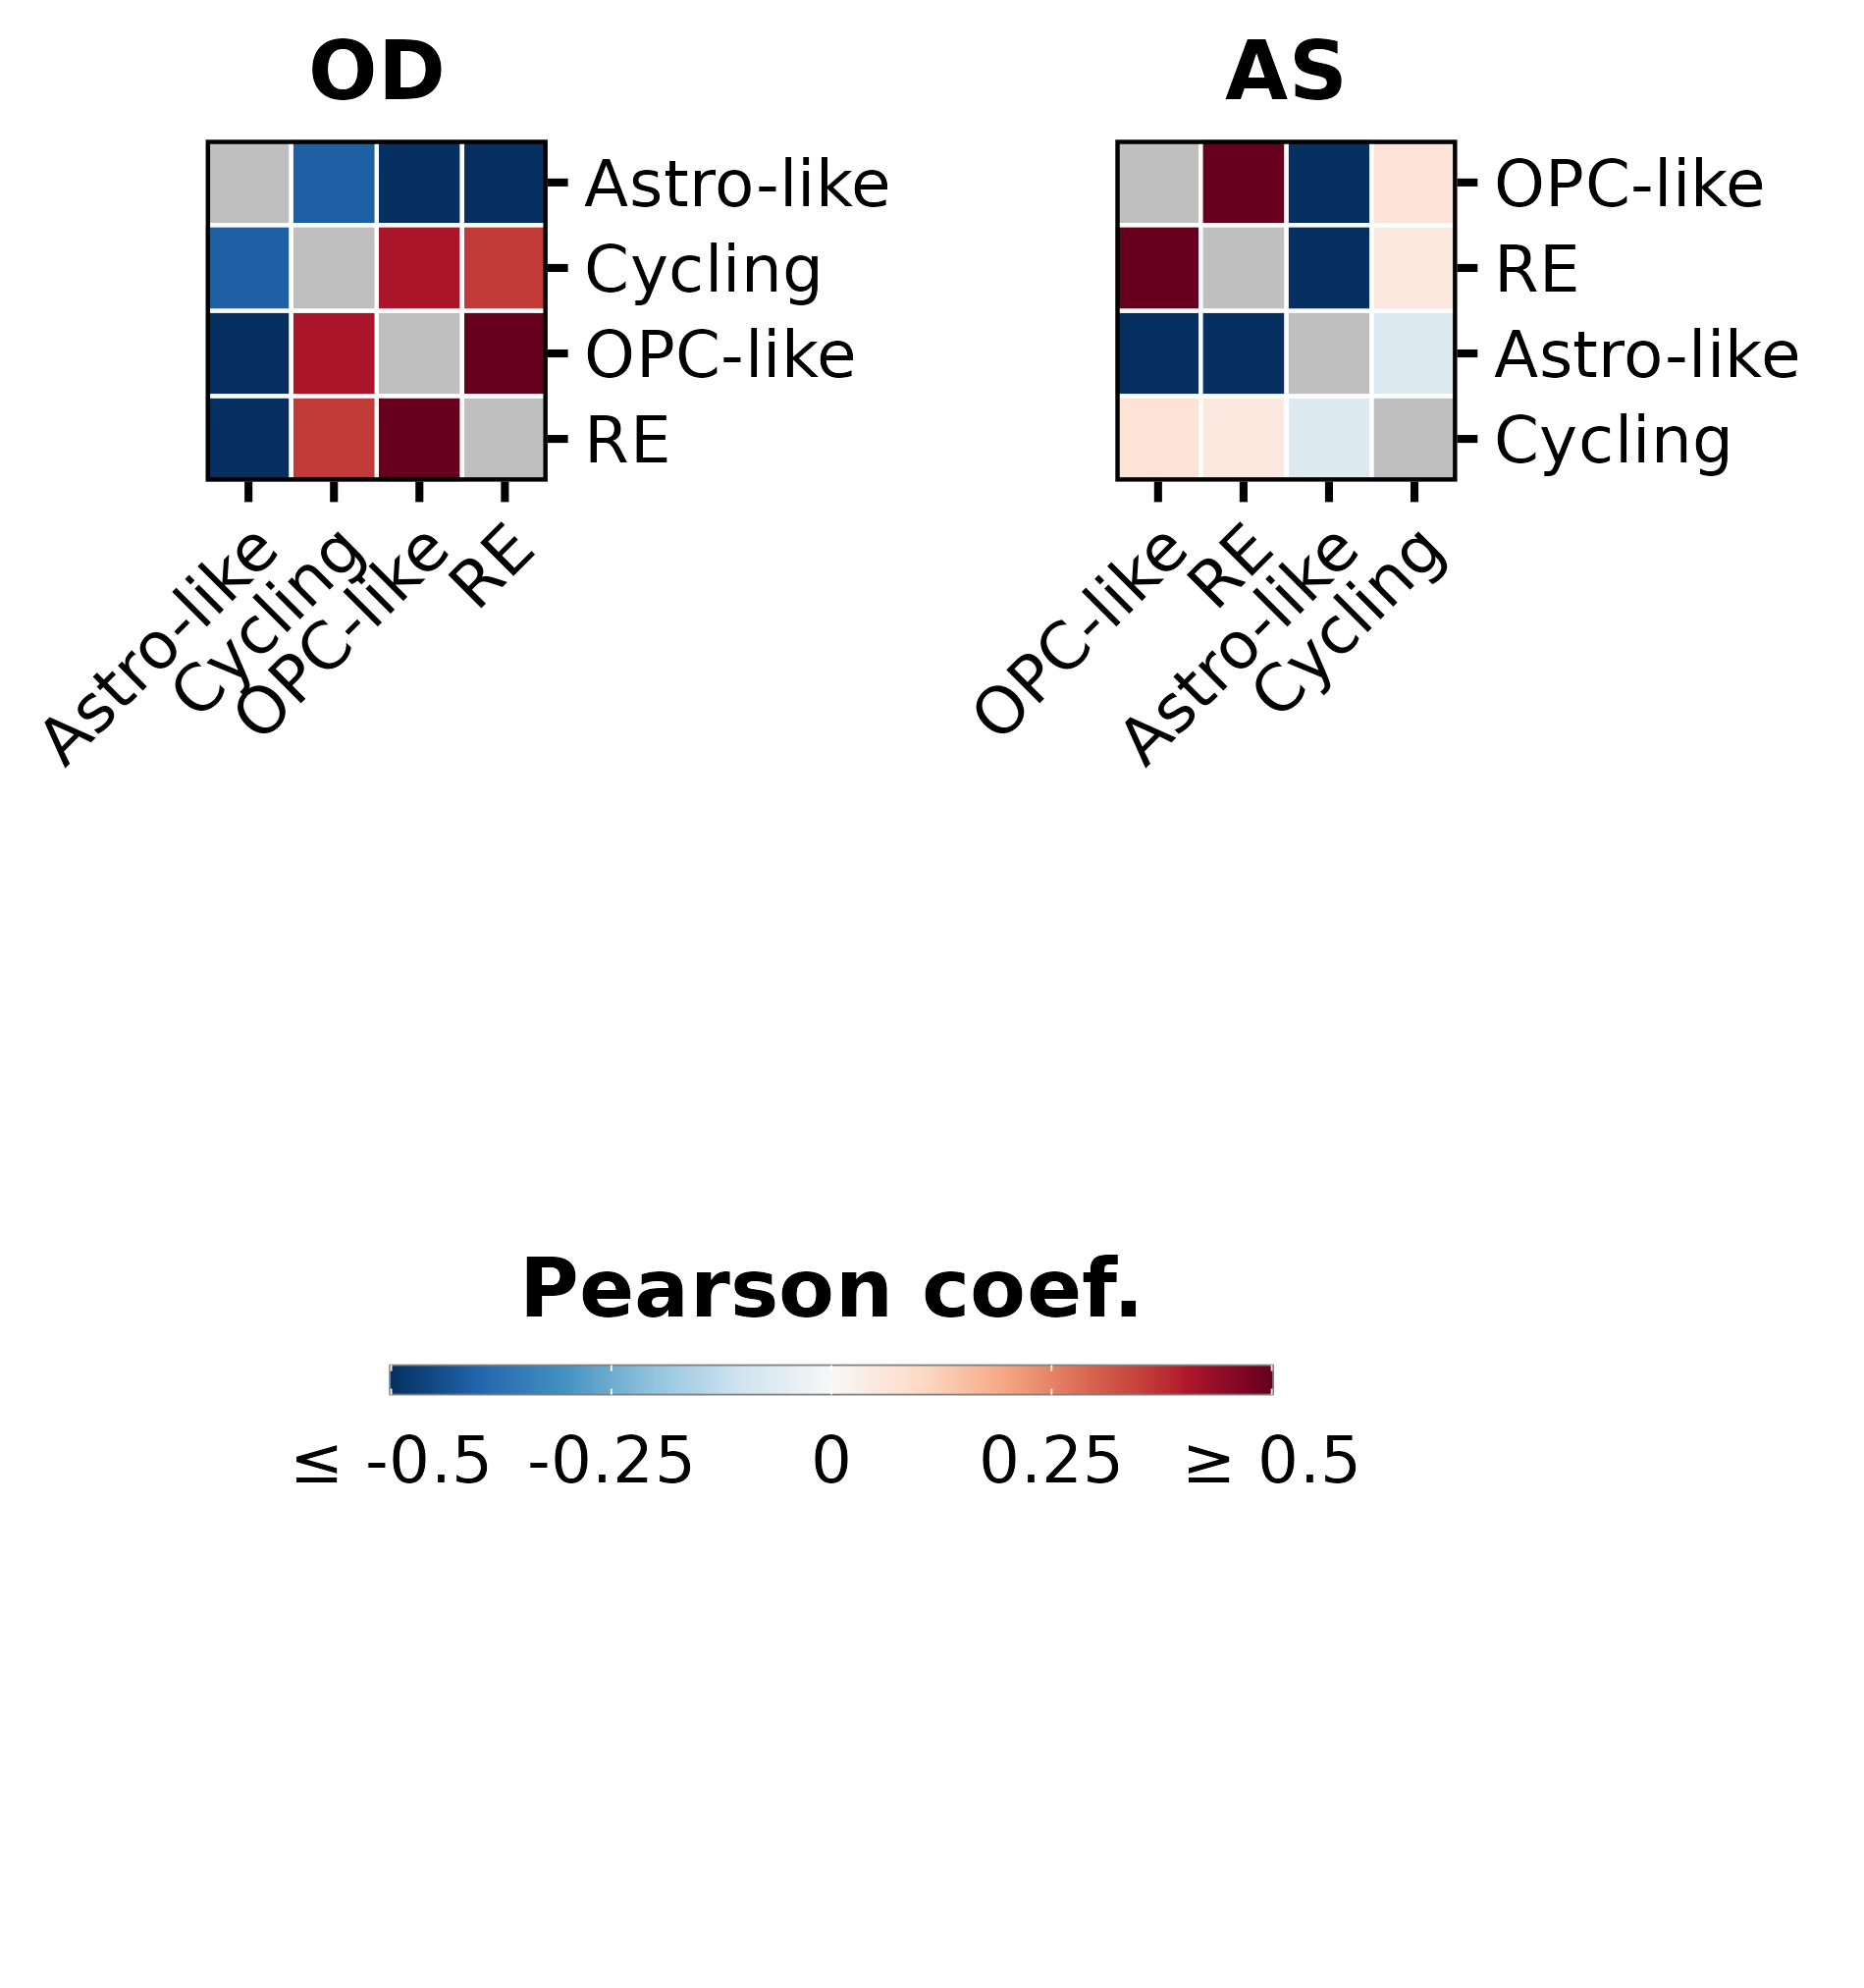
p1 <- SCpubr::do_CorrelationPlot(sample.oligo,
                                 mode = "hvg",
                                 assay = "ATAC",
                                 max.cutoff = 0.5,
                                 min.cutoff = -0.5,
                                 font.size = 20,
                                 legend.length = 15,
                                 legend.width = 0.5,
                                 legend.framecolor = "grey50",
                                 legend.tickcolor = "white",
                                 legend.framewidth = 0.2,
                                 legend.tickwidth = 0.2,
                                 axis.text.face = "plain",
                                 legend.position = "none") +
      ggplot2::xlab("OD")

p2 <- SCpubr::do_CorrelationPlot(sample.astro,
                                 mode = "hvg",
                                 assay = "ATAC",
                                 max.cutoff = 0.5,
                                 min.cutoff = -0.5,
                                 font.size = 20,
                                 legend.length = 15,
                                 legend.width = 0.5,
                                 legend.framecolor = "grey50",
                                 legend.tickcolor = "white",
                                 legend.framewidth = 0.2,
                                 legend.tickwidth = 0.2,
                                 axis.text.face = "plain")  +
       ggplot2::xlab("AS")

p <- patchwork::wrap_plots(A = p1, B = p2, C = patchwork::guide_area(),design = "AB
                                                                                 CC", guides = "collect")
