data <- sample@meta.data %>%
dplyr::filter(!(.data$orig.ident %in% c("IDH_NCH511B", "IDH_NCH2367", "IDH_NCH740W", "IDH_NCH678K"))) %>%
dplyr::select(dplyr::all_of(c("final_annotation", "time", "pair"))) %>%
tibble::as_tibble() %>%
dplyr::group_by(.data$time, .data$pair, .data$final_annotation) %>%
dplyr::summarise("n" = dplyr::n(),
"time" := unique(.data$time),
"final_annotation" := unique(.data$final_annotation),
"time" = unique(.data$time)) %>%
dplyr::ungroup() %>%
tidyr::complete(.data$pair, .data$time, .data$final_annotation) %>%
dplyr::mutate(dplyr::across(dplyr::everything(), function(x){ifelse(is.na(x), 0, x)})) %>%
dplyr::group_by(.data$time, .data$pair) %>%
dplyr::mutate("pair" = factor(.data$pair),
"time" = factor(.data$time),
"final_annotation" = factor(.data$final_annotation)) %>%
dplyr::reframe("freq" = .data$n / sum(.data$n),
"time" := unique(.data$time),
"final_annotation" := unique(.data$final_annotation),
"pair" := unique(.data$pair)) %>%
tidyr::pivot_wider(names_from = "time",
values_from = "freq")
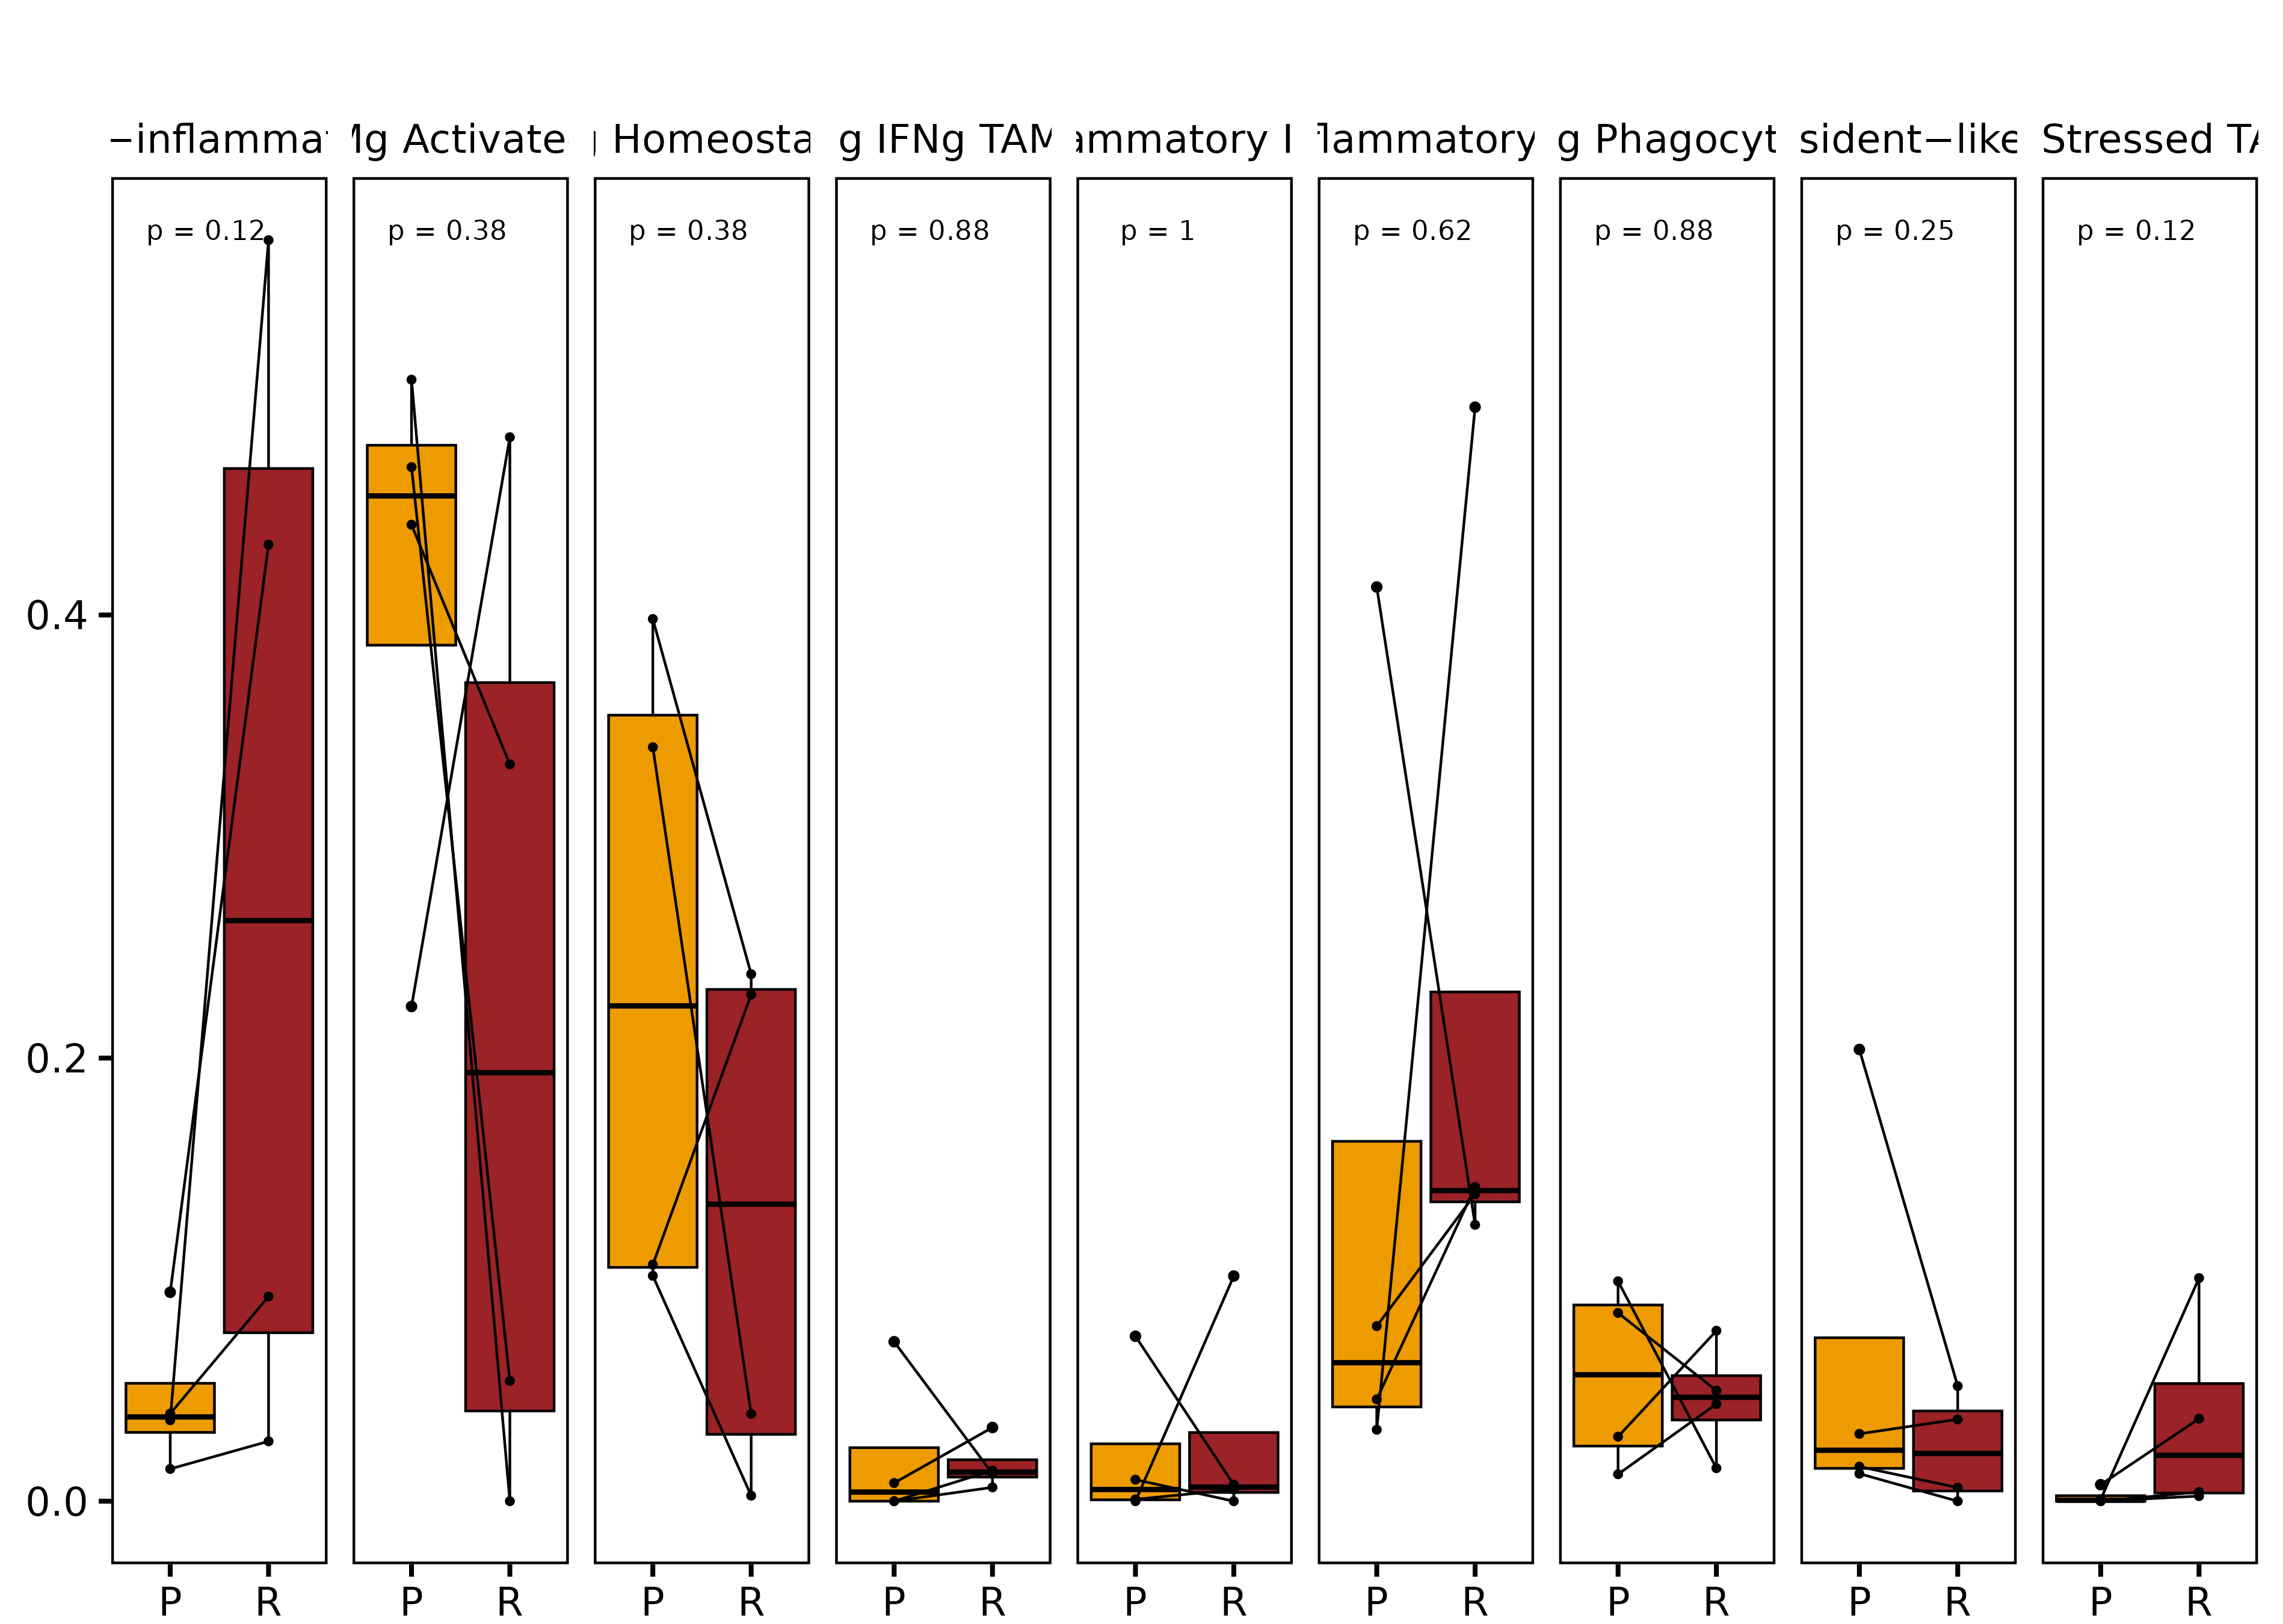
p <- data %>%
ggpubr::ggpaired(cond1 = "P",
cond2 = "R",
facet.by = "final_annotation",
color = "black",
fill = "condition",
label.rectangle = FALSE,
width = 0.9,
outlier.color = "black",
outlier.alpha = 0.5,
fatten = 1,
key_glyph = "rect",
nrow = 1) +
ggpubr::stat_compare_means(label = "p.format",
paired = TRUE,
method = "wilcox.test") +
ggplot2::scale_fill_manual(values = scale.status) +
ggplot2::theme_minimal(base_size = 20) +
ggplot2::theme(axis.ticks.x.bottom = ggplot2::element_line(color = "black"),
axis.ticks.x.top = ggplot2::element_blank(),
axis.ticks.y.left = ggplot2::element_line(color = "black"),
axis.ticks.y.right = ggplot2::element_blank(),
axis.text.y.left = ggplot2::element_text(color = "black", face = "plain"),
axis.text.y.right = ggplot2::element_blank(),
axis.text.x.top = ggplot2::element_blank(),
axis.text.x.bottom = ggplot2::element_text(color = "black", face = "plain"),
axis.title.x.bottom = ggplot2::element_blank(),
axis.title.x.top = ggplot2::element_blank(),
axis.title.y.right = ggplot2::element_blank(),
axis.title.y.left = ggplot2::element_blank(),
strip.text = ggplot2::element_text(face = "plain", color = "black"),
axis.line = ggplot2::element_blank(),
plot.title = ggplot2::element_text(face = "bold", hjust = 0),
plot.subtitle = ggplot2::element_text(hjust = 0),
plot.caption = ggplot2::element_text(hjust = 1),
plot.title.position = "plot",
panel.grid = ggplot2::element_blank(),
panel.grid.minor.y = ggplot2::element_line(color = "white", linewidth = 1),
text = ggplot2::element_text(family = "sans"),
plot.caption.position = "plot",
legend.text = ggplot2::element_text(face = "bold"),
legend.title = ggplot2::element_text(face = "bold"),
legend.justification = "center",
plot.margin = ggplot2::margin(t = 40, r = 10, b = 0, l = 10),
panel.border = ggplot2::element_rect(fill = NA, color = "black", linewidth = 1),
panel.grid.major = ggplot2::element_blank(),
legend.position = "none",
legend.spacing = ggplot2::unit(10, unit = "mm"),
plot.background = ggplot2::element_rect(fill = "white", color = "white"),
panel.background = ggplot2::element_rect(fill = "white", color = "white"),
legend.background = ggplot2::element_rect(fill = "white", color = "white"),
legend.key = ggplot2::element_rect(linewidth = 1, color = "white"),
legend.key.size = ggplot2::unit(1, 'lines'))