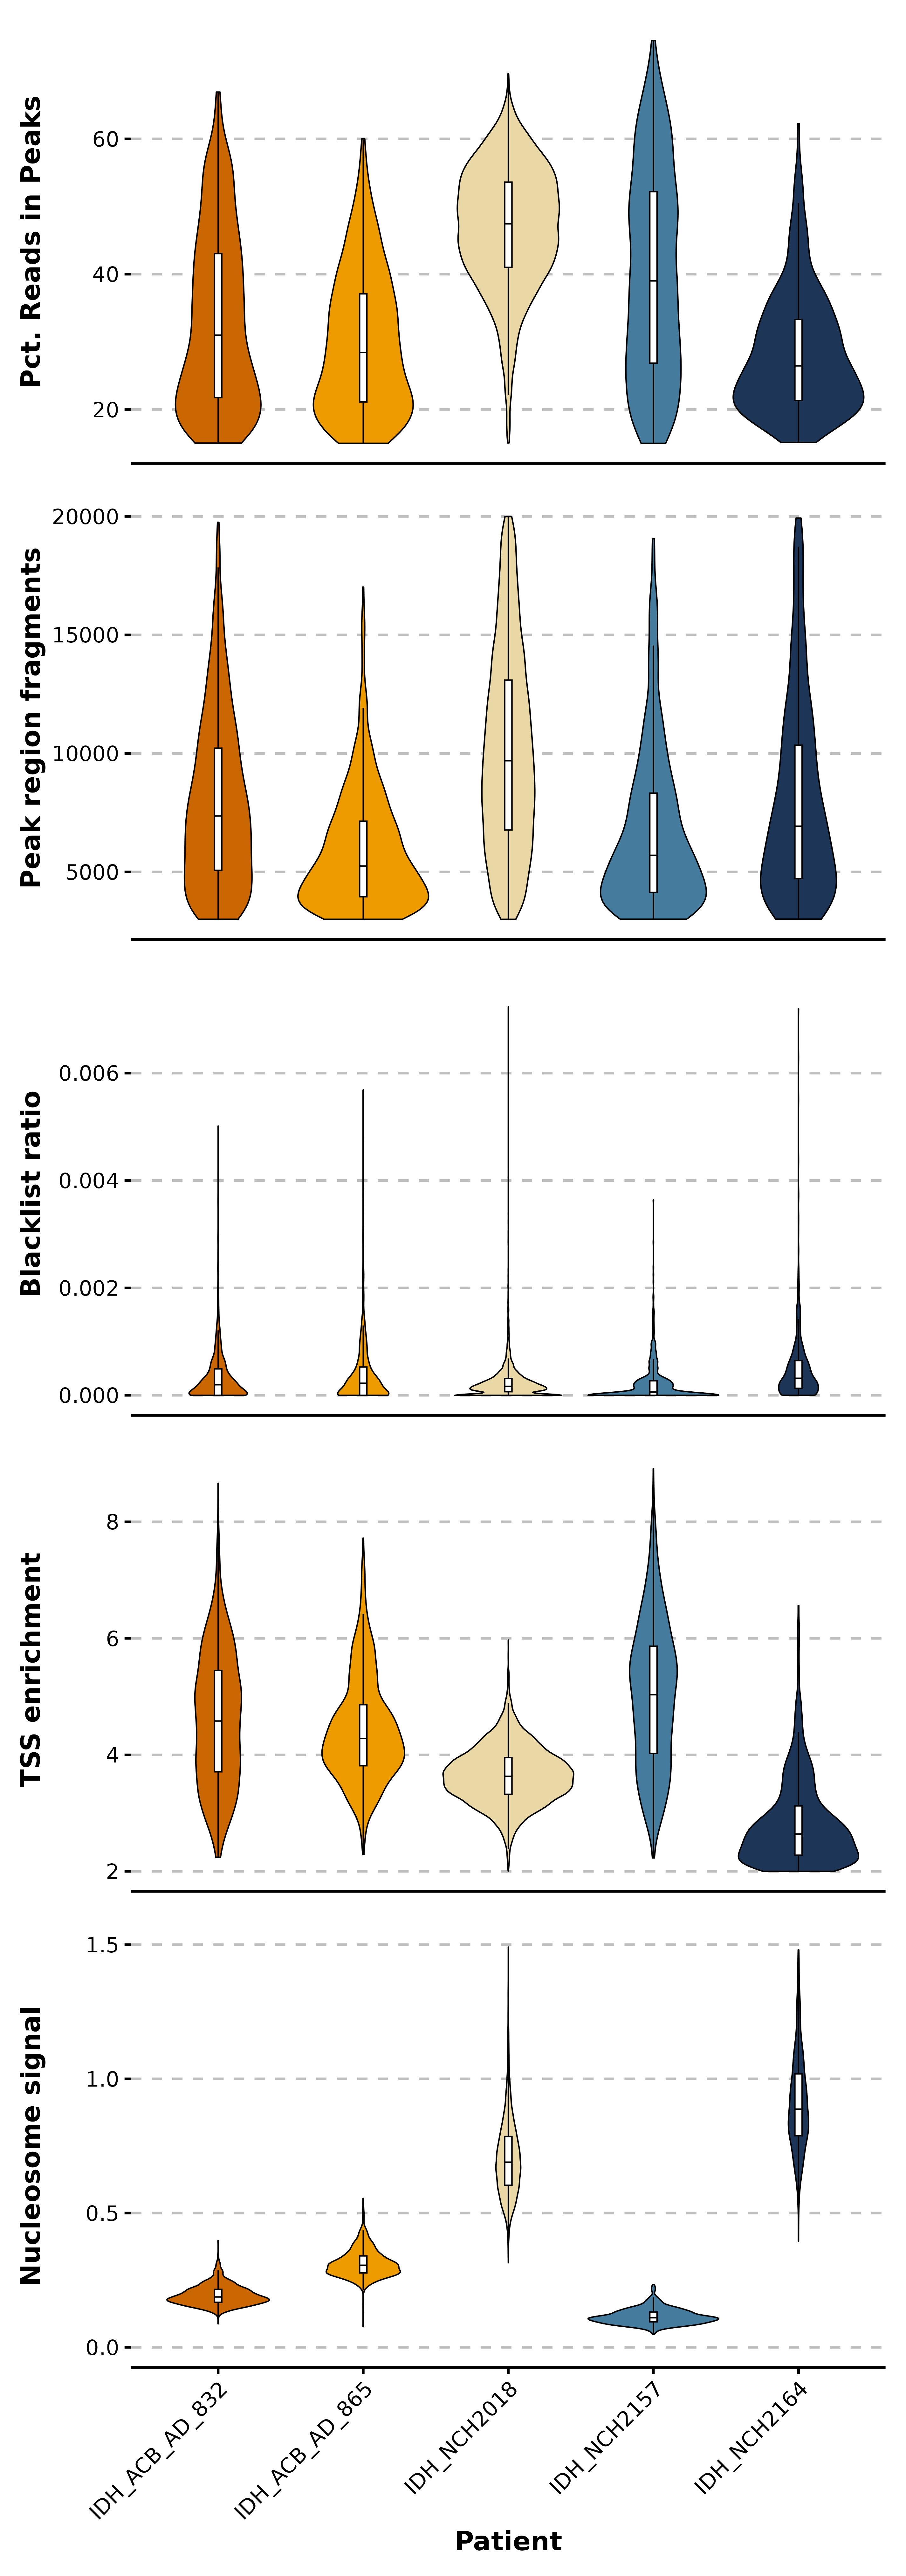
p1 <- SCpubr::do_ViolinPlot(sample = sample,
                            group.by = "orig.ident",
                            features = "percentage_reads_in_peaks",
                            colors.use = scale.ident,
                            boxplot_width = 0.05,
                            font.size = 20,
                            axis.text.face = "plain") +
      ggplot2::labs(y = "Pct. Reads in Peaks",
                    x = "") +
      ggplot2::theme(axis.text.x = ggplot2::element_blank(),
                     axis.ticks.x = ggplot2::element_blank(),
                     axis.title.x = ggplot2::element_blank())

p2 <- SCpubr::do_ViolinPlot(sample = sample,
                            group.by = "orig.ident",
                            features = "peak_region_fragments",
                            colors.use = scale.ident,
                            boxplot_width = 0.05,
                            font.size = 20,
                            axis.text.face = "plain") +
      ggplot2::labs(y = "Peak region fragments",
                    x = "") +
      ggplot2::theme(axis.text.x = ggplot2::element_blank(),
                     axis.ticks.x = ggplot2::element_blank(),
                     axis.title.x = ggplot2::element_blank())

p3 <- SCpubr::do_ViolinPlot(sample = sample,
                            group.by = "orig.ident",
                            features = "blacklist_ratio",
                            colors.use = scale.ident,
                            boxplot_width = 0.05,
                            font.size = 20,
                            axis.text.face = "plain") +
      ggplot2::labs(y = "Blacklist ratio",
                    x = "") +
      ggplot2::scale_y_continuous(limits = c(0, 0.0075)) +
      ggplot2::theme(axis.text.x = ggplot2::element_blank(),
                     axis.ticks.x = ggplot2::element_blank(),
                     axis.title.x = ggplot2::element_blank())

p4 <- SCpubr::do_ViolinPlot(sample = sample,
                            group.by = "orig.ident",
                            features = "TSS.enrichment",
                            colors.use = scale.ident,
                            boxplot_width = 0.05,
                            font.size = 20,
                            axis.text.face = "plain") +
      ggplot2::labs(y = "TSS enrichment",
                    x = "") +
      ggplot2::theme(axis.text.x = ggplot2::element_blank(),
                     axis.ticks.x = ggplot2::element_blank(),
                     axis.title.x = ggplot2::element_blank())

p5 <- SCpubr::do_ViolinPlot(sample = sample,
                            group.by = "orig.ident",
                            features = "nucleosome_signal",
                            colors.use = scale.ident,
                            boxplot_width = 0.05,
                            font.size = 20,
                            axis.text.face = "plain") +
      ggplot2::labs(y = "Nucleosome signal",
                    x = "Patient") +
      ggplot2::scale_y_continuous(limits = c(0, 1.5))

p <- p1 / p2 / p3 / p4 / p5
