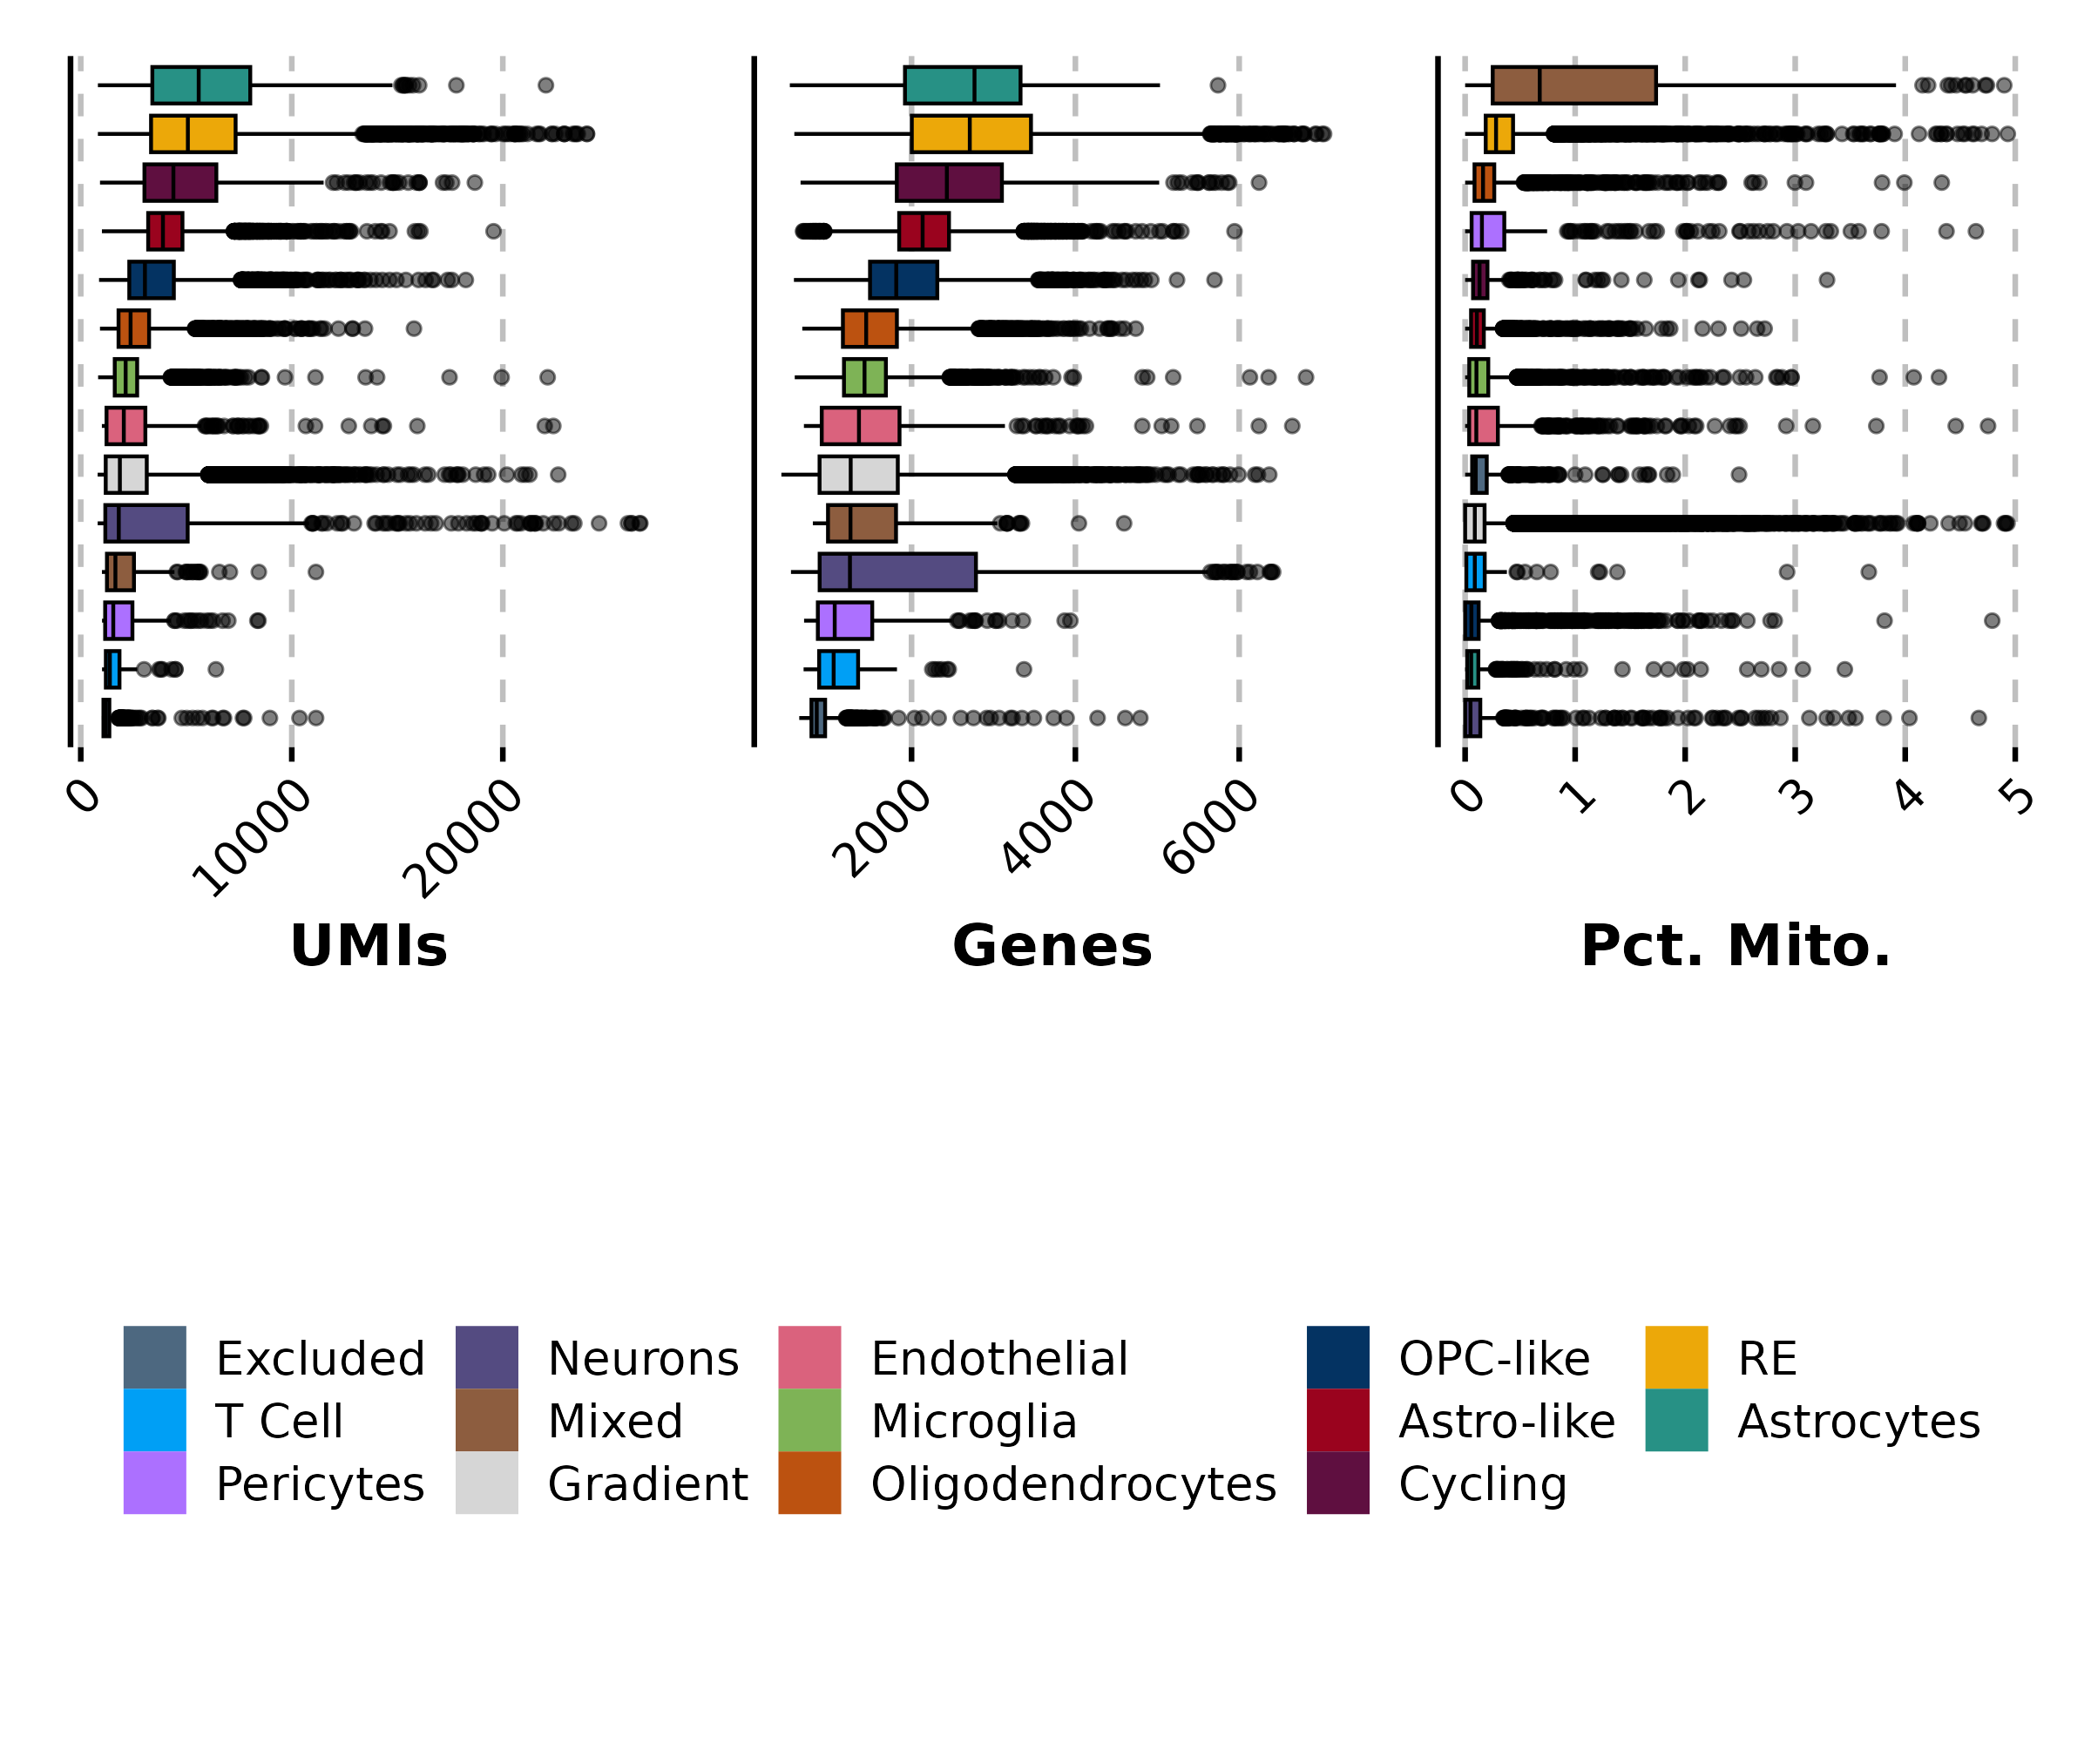
p1 <- SCpubr::do_BoxPlot(sample = sample,
                         feature = "nCount_RNA",
                         group.by = "relabelling",
                         order = TRUE,
                         colors.use = cluster_cols,
                         boxplot.linewidth = 0.5,
                         font.size = 16,
                         flip = TRUE) +
       ggplot2::theme(axis.text.y = ggplot2::element_blank(),
                      axis.ticks.y = ggplot2::element_blank(),
                      axis.title.y = ggplot2::element_blank()) +
       ggplot2::labs(x = "",
                     y = "UMIs")

p2 <- SCpubr::do_BoxPlot(sample = sample,
                         feature = "nFeature_RNA",
                         group.by = "relabelling",
                         order = TRUE,
                         colors.use = cluster_cols,
                         boxplot.linewidth = 0.5,
                         font.size = 16,
                         flip = TRUE,
                         legend.position = "bottom",
                         legend.title = "") +
       ggplot2::theme(axis.text.y = ggplot2::element_blank(),
                      axis.ticks.y = ggplot2::element_blank(),
                      axis.title.y = ggplot2::element_blank()) +
       ggplot2::labs(x = "",
                     y = "Genes")

p3 <- SCpubr::do_BoxPlot(sample = sample,
                         feature = "percent.mt",
                         group.by = "relabelling",
                         order = TRUE,
                         colors.use = cluster_cols,
                         boxplot.linewidth = 0.5,
                         font.size = 16,
                         flip = TRUE)+
       ggplot2::theme(axis.text.y = ggplot2::element_blank(),
                      axis.ticks.y = ggplot2::element_blank(),
                      axis.title.y = ggplot2::element_blank()) +
       ggplot2::labs(x = "",
                     y = "Pct. Mito.")

layout <- "ABC
           DDD"

p <- patchwork::wrap_plots(A = p1, B = p2, C = p3, D = patchwork::guide_area(), design = layout, guides = "collect")
