# Enrique Blanco Carmona
# e.blancocarmona@kitz-heidelberg.de
# PhD Student – Clinical Bioinformatics
# Division of Pediatric Neurooncology (B062)
# DKFZ-KiTZ | Germany
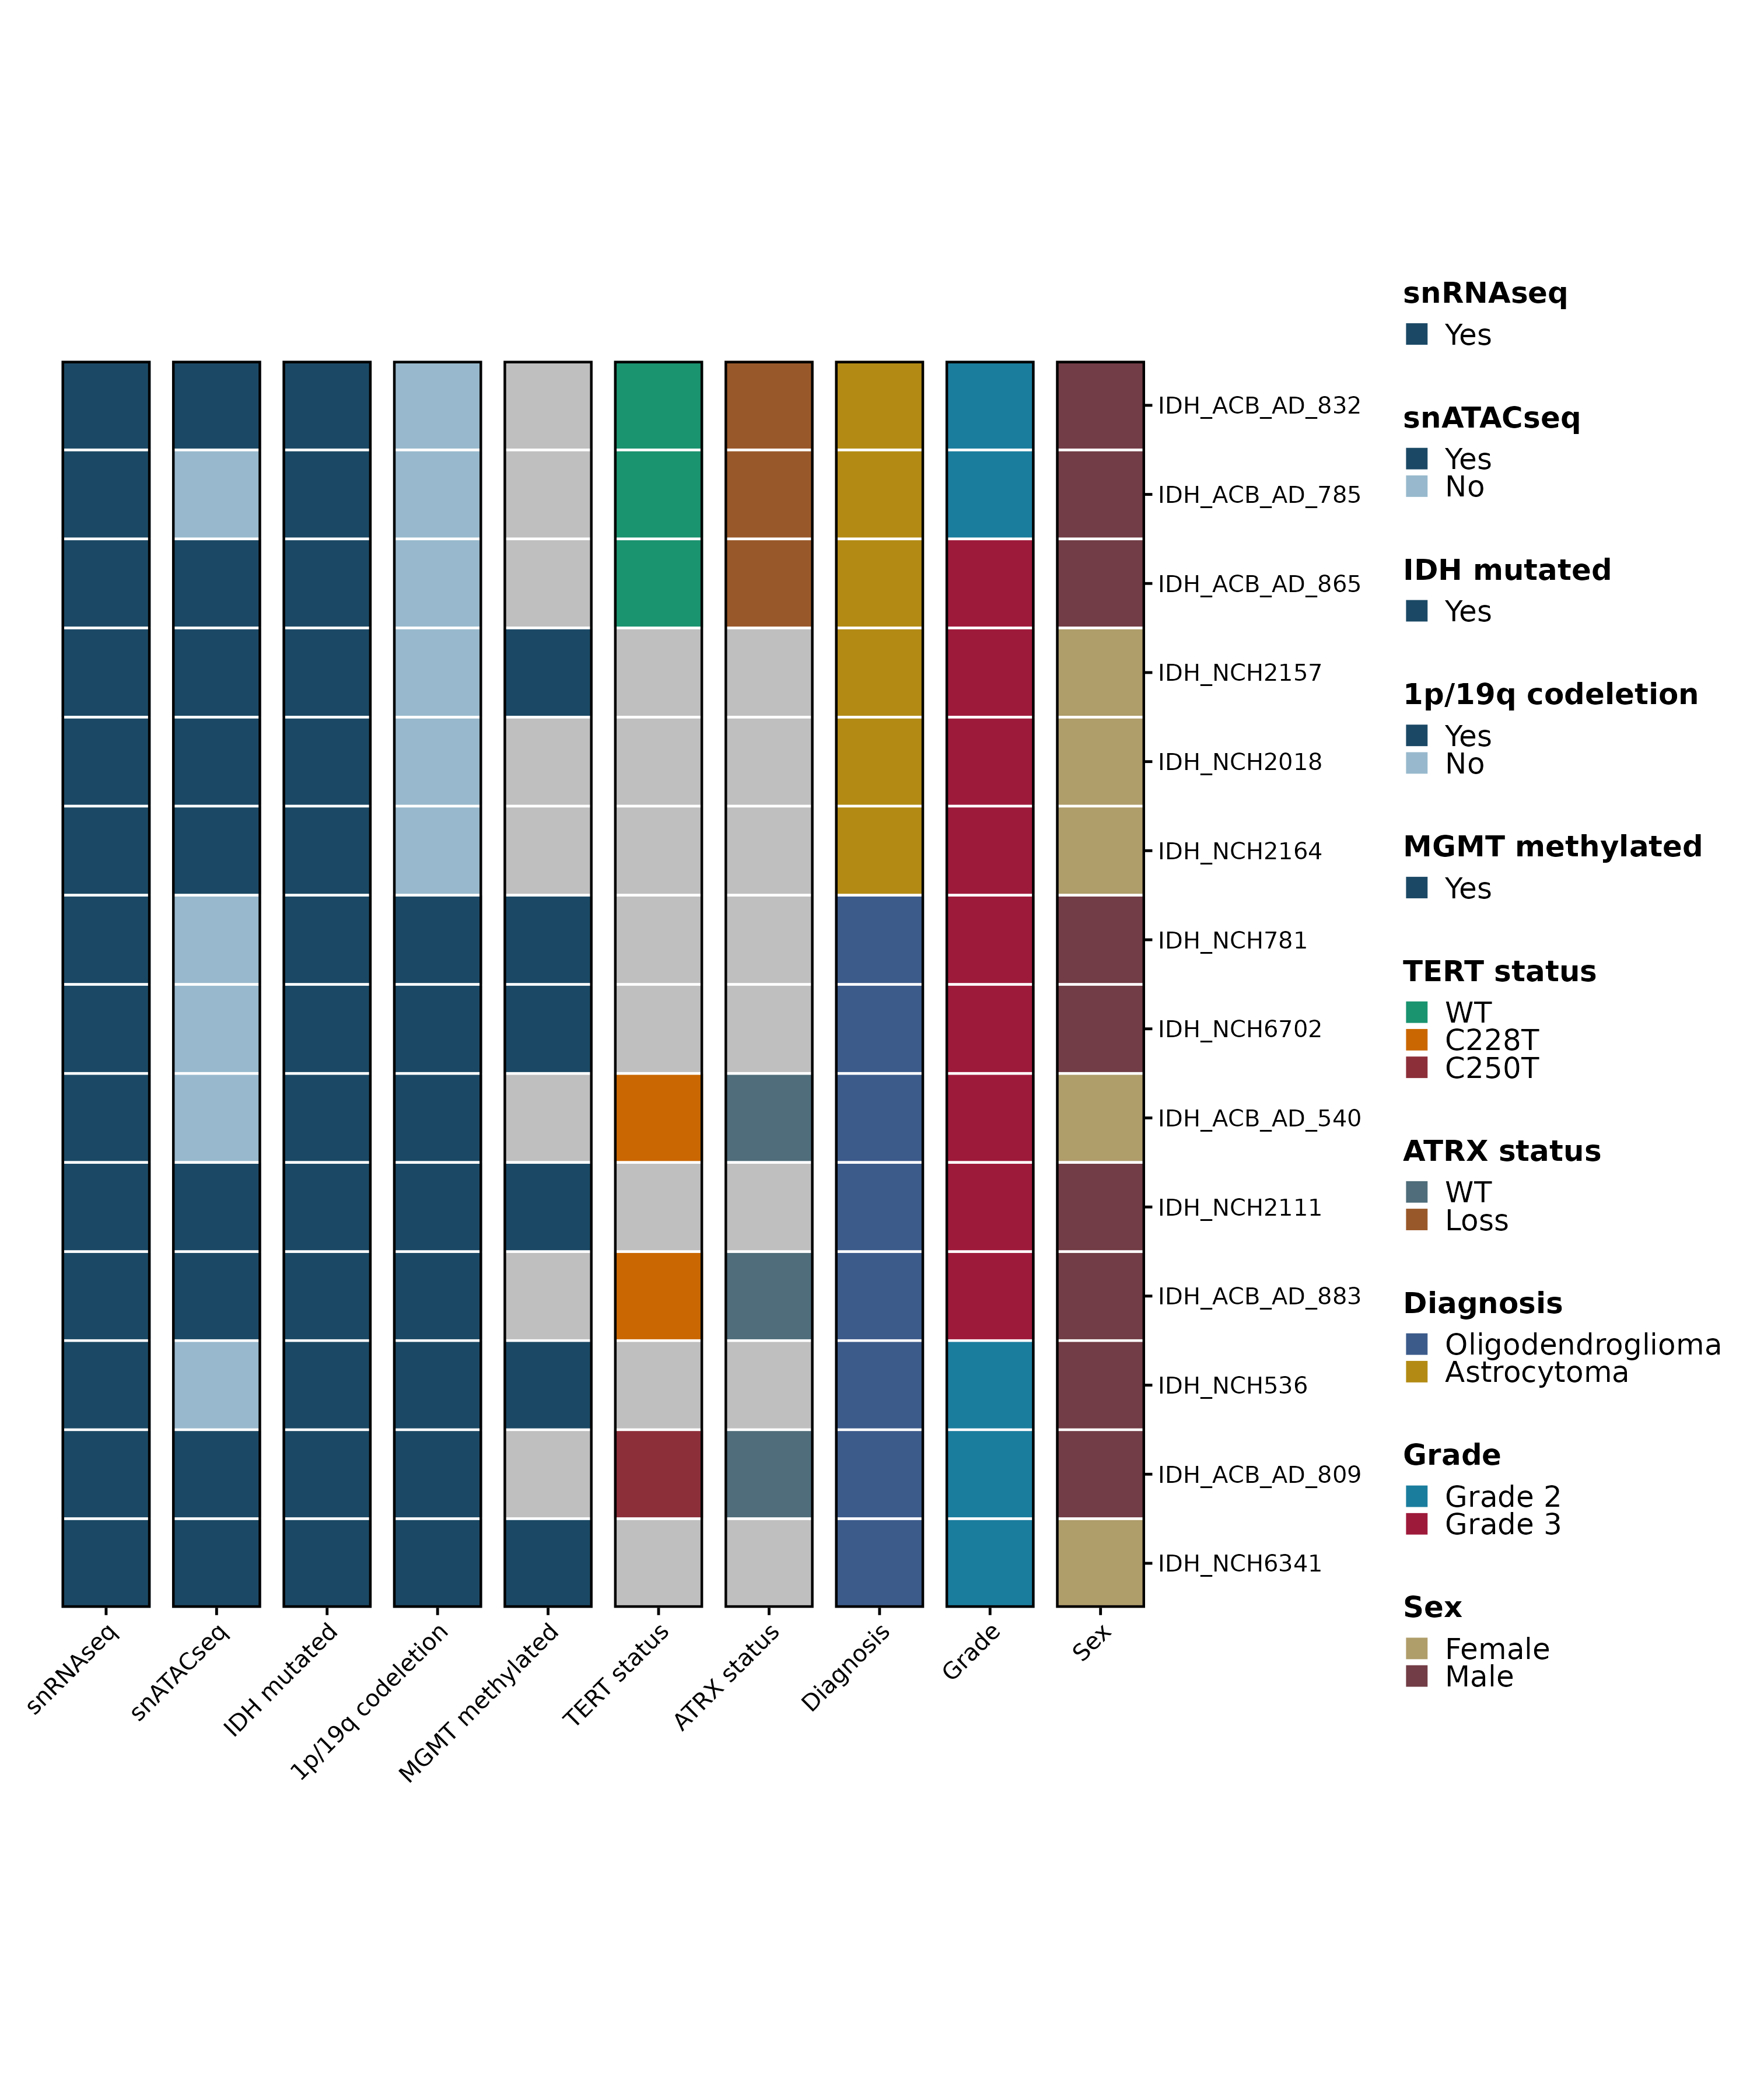
# Read in metadata.
metadata <- as.data.frame(readxl::read_excel("/omics/odcf/analysis/OE0145_projects/idh_gliomas/Figures_Science/revision/IDH_gliomas_book/datasets/primary_samples_metadata.xlsx"))
# Process metadata.
rownames(metadata) <- metadata$Samples
metadata$Samples <- NULL
metadata <- metadata %>%
dplyr::filter(Diagnosis != "GBM-like") %>%
as.data.frame() %>%
tibble::rownames_to_column(var = "ID") %>%
tibble::as_tibble() %>%
dplyr::mutate_all(.funs = function(x){ifelse(x == "NA", NA, x)}) %>%
dplyr::mutate("snRNAseq" = factor(.data$snRNAseq, levels = c("Yes", "No")),
"snATACseq" = factor(.data$snATACseq, levels = c("Yes", "No")),
"IDH mutated" = factor(.data$`IDH mutated`, levels = c("Yes", "No")),
"1p/19q codeletion" = factor(.data$`1p/19q codeletion`, levels = c("Yes", "No")),
"MGMT methylated" = factor(.data$`MGMT methylated`, levels = c("Yes", "No")),
"TERT status" = factor(.data$`TERT status`, levels = c("WT", "C228T", "C250T")),
"ATRX status" = factor(.data$`ATRX status`, levels = c("WT", "Loss")),
"Diagnosis" = factor(.data$Diagnosis, levels = c("Oligodendroglioma", "Astrocytoma")),
"Grade" = factor(.data$Grade, levels = c("Grade 2", "Grade 3")),
"Sex" = factor(.data$Sex, levels = c("Female", "Male"))) %>%
tibble::column_to_rownames(var = "ID") %>%
as.data.frame()
# Define colors.
yes_no_colors <- c("Yes" = "#1b4965", "No" = "#98b9cd")
colors.use <- list("snRNAseq" = yes_no_colors,
"snATACseq" = yes_no_colors,
"IDH mutated" = yes_no_colors,
"1p/19q codeletion" = yes_no_colors,
"MGMT methylated" = yes_no_colors,
"TERT status" = c("WT" = "#1a936f", "C228T" = "#ca6702", "C250T" = "#8c2f39"),
"ATRX status" = c("WT" = "#4f6d7a", "Loss" = "#99582a"),
"Diagnosis" = c("Oligodendroglioma" = "#3c5b8b", "Astrocytoma" = "#b38b14"),
"Grade" = c("Grade 2" = "#1a7d9e", "Grade 3" = "#9e1a3b"),
"Sex" = c("Male" = "#723d46", "Female" = "#af9d6a"))
# Plot.
p1 <- SCpubr::do_MetadataPlot(from_df = TRUE,
df = metadata,
legend.position = "null",
legend.ncol = 1,
colors.use = colors.use,
axis.text.face = "plain",
font.size = 12,
legend.font.size = 12,
legend.symbol.size = 4) &
ggplot2::ylab("")
p2 <- SCpubr::do_MetadataPlot(from_df = TRUE,
df = metadata,
legend.position = "right",
legend.ncol = 1,
colors.use = colors.use,
axis.text.face = "plain",
font.size = 12,
legend.font.size = 12,
legend.symbol.size = 4) &
ggplot2::ylab("")