Figure 2F

Code
# Inma Hernandez Lopez
# inmaculada.hernandez-lopez@ukr.de
# LIT -  Leibniz-Institute für Immunotherapie

# Enrique Blanco Carmona
# e.blancocarmona@kitz-heidelberg.de
# PhD Student – Clinical Bioinformatics
# Division of Pediatric Neurooncology (B062)
# DKFZ-KiTZ | Germany


sample.oligo <- readRDS("/omics/odcf/analysis/OE0145_projects/idh_gliomas/Figures_Science/revision/IDH_gliomas_book/datasets/primary_ATAC_OD.rds")
sample.astro <- readRDS("/omics/odcf/analysis/OE0145_projects/idh_gliomas/Figures_Science/revision/IDH_gliomas_book/datasets/primary_ATAC_AS.rds")

sample.oligo$relabelling[sample.oligo$relabelling == "RA"] <- "RE"
sample.astro$relabelling[sample.astro$relabelling == "RA"] <- "RE"


Seurat::Idents(sample.oligo) <- sample.oligo$relabelling
Seurat::Idents(sample.astro) <- sample.astro$relabelling

# Colors to use.
cluster_cols <- c("RE" = "#ECA809",
                  "OPC-like" = "#043362",                    
                  "T Cell" = "#009FF5",                   
                  "Oligodendrocytes" = "#BC5210",            
                  "Astrocytes" = "#279185",                  
                  "Microglia" = "#7EB356",                   
                  "Pericytes" = "#AC70FF",                  
                  "Mixed" = "#8d5d3f",                   
                  "Gradient" = "#D6D6D6",                    
                  "Neurons" = "#544B81",                   
                  "Endothelial" = "#da627d",                 
                  "Astro-like" = "#9A031E",                 
                  "Cycling" = "#5F0F40")
Code
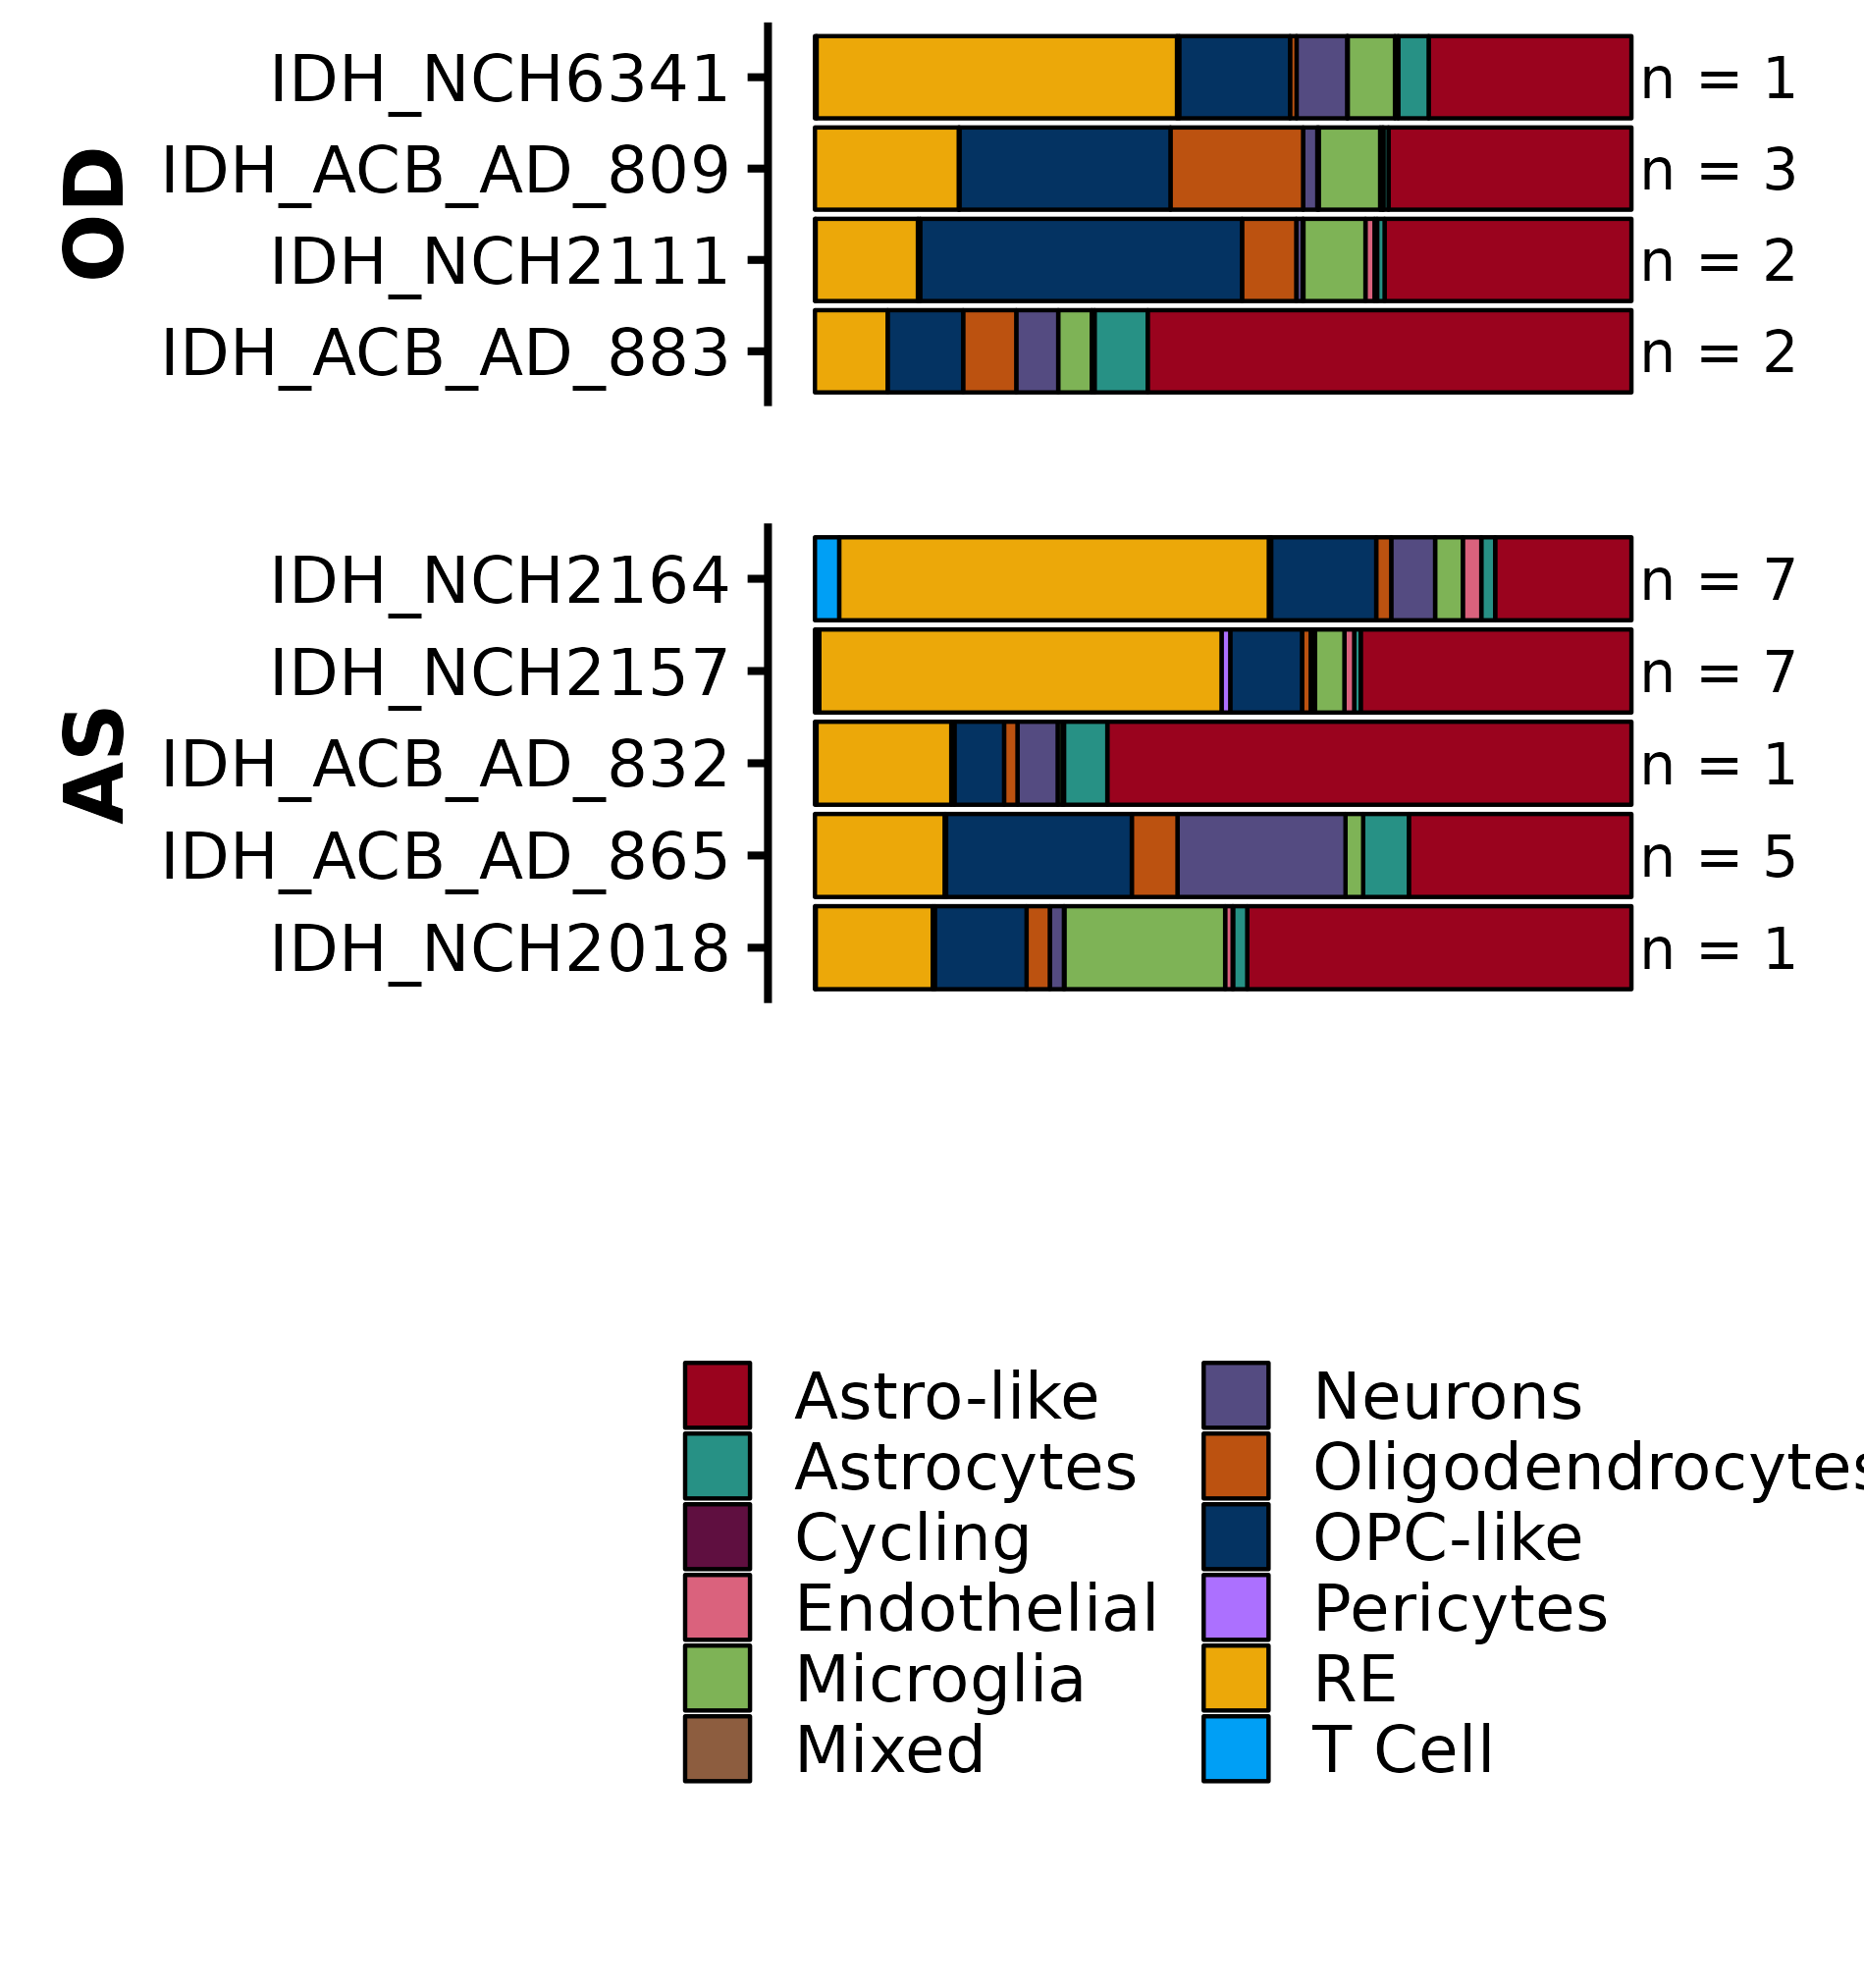
p0 <- SCpubr::do_BarPlot(sample = sample.oligo,
                         group.by = "relabelling",
                         split.by = "orig.ident",
                         facet.by = "subtype",
                         font.size = 20,
                         flip = TRUE,
                         colors.use = cluster_cols,
                         position = "fill",
                         legend.position = "none",
                         order = TRUE,
                         order.by = "RE",
                         plot.grid = FALSE,
                         add.n = TRUE,
                         add.n.expand = c(0, 1.15),
                         axis.text.face = "plain",
                         add.n.size = 5) +
      ggplot2::xlab("OD") +
      ggplot2::ylab("") + 
      ggplot2::theme(axis.text.x = ggplot2::element_blank(),
                     axis.ticks.x = ggplot2::element_blank(),
                     strip.text = ggplot2::element_blank(),
                     plot.margin = ggplot2::margin(t = 0, r = 10, b = 0, l = 10)) 

p1 <- SCpubr::do_BarPlot(sample = sample.astro,
                         group.by = "relabelling",
                         split.by = "orig.ident",
                         facet.by = "subtype",
                         font.size = 20,
                         flip = TRUE,
                         colors.use = cluster_cols,
                         position = "fill",
                         legend.position = "bottom",
                         order = TRUE,
                         order.by = "RE",
                         plot.grid = FALSE,
                         add.n = TRUE,
                         add.n.expand = c(0, 1.15),
                         axis.text.face = "plain",
                         add.n.size = 5,
                         legend.ncol = 2,
                         legend.title = "") +
      ggplot2::xlab("AS") +
      ggplot2::ylab("") + 
      ggplot2::theme(axis.text.x = ggplot2::element_blank(),
                     axis.ticks.x = ggplot2::element_blank(),
                     strip.text = ggplot2::element_blank(),
                     plot.margin = ggplot2::margin(t = 0, r = 10, b = 0, l = 10)) 

layout <- paste(c(rep("A", 4), rep("B", 5), "C"), collapse = "\n")

p <- patchwork::wrap_plots(A = p0,
                           B = p1,
                           C = patchwork::guide_area(),
                           design = layout)