Figure S2G

Code
# Enrique Blanco Carmona
# e.blancocarmona@kitz-heidelberg.de
# PhD Student – Clinical Bioinformatics
# Division of Pediatric Neurooncology (B062)
# DKFZ-KiTZ | Germany

sample <- readRDS("/omics/odcf/analysis/OE0145_projects/idh_gliomas/Figures_Science/revision/IDH_gliomas_book/datasets/integrated_paired_AS.rds")

cluster_cols <- c("RE" = "#ECA809",
                  "OPC-like" = "#043362",                    
                  "T Cell" = "#009FF5",                   
                  "Oligodendrocytes" = "#BC5210",            
                  "Astrocytes" = "#279185",                  
                  "Microglia" = "#7EB356",                   
                  "Pericytes" = "#AC70FF",                  
                  "Mixed" = "#8d5d3f",                   
                  "Gradient" = "#D6D6D6",                    
                  "Neurons" = "#544B81",                   
                  "Endothelial" = "#da627d",                 
                  "Astro-like" = "#9A031E",                 
                  "Cycling" = "#5F0F40")

sample$relabelling[sample$relabelling == "RA"] <- "RE"
Seurat::Idents(sample) <- sample$relabelling
Code
p1 <- SCpubr::do_BoxPlot(sample = sample, 
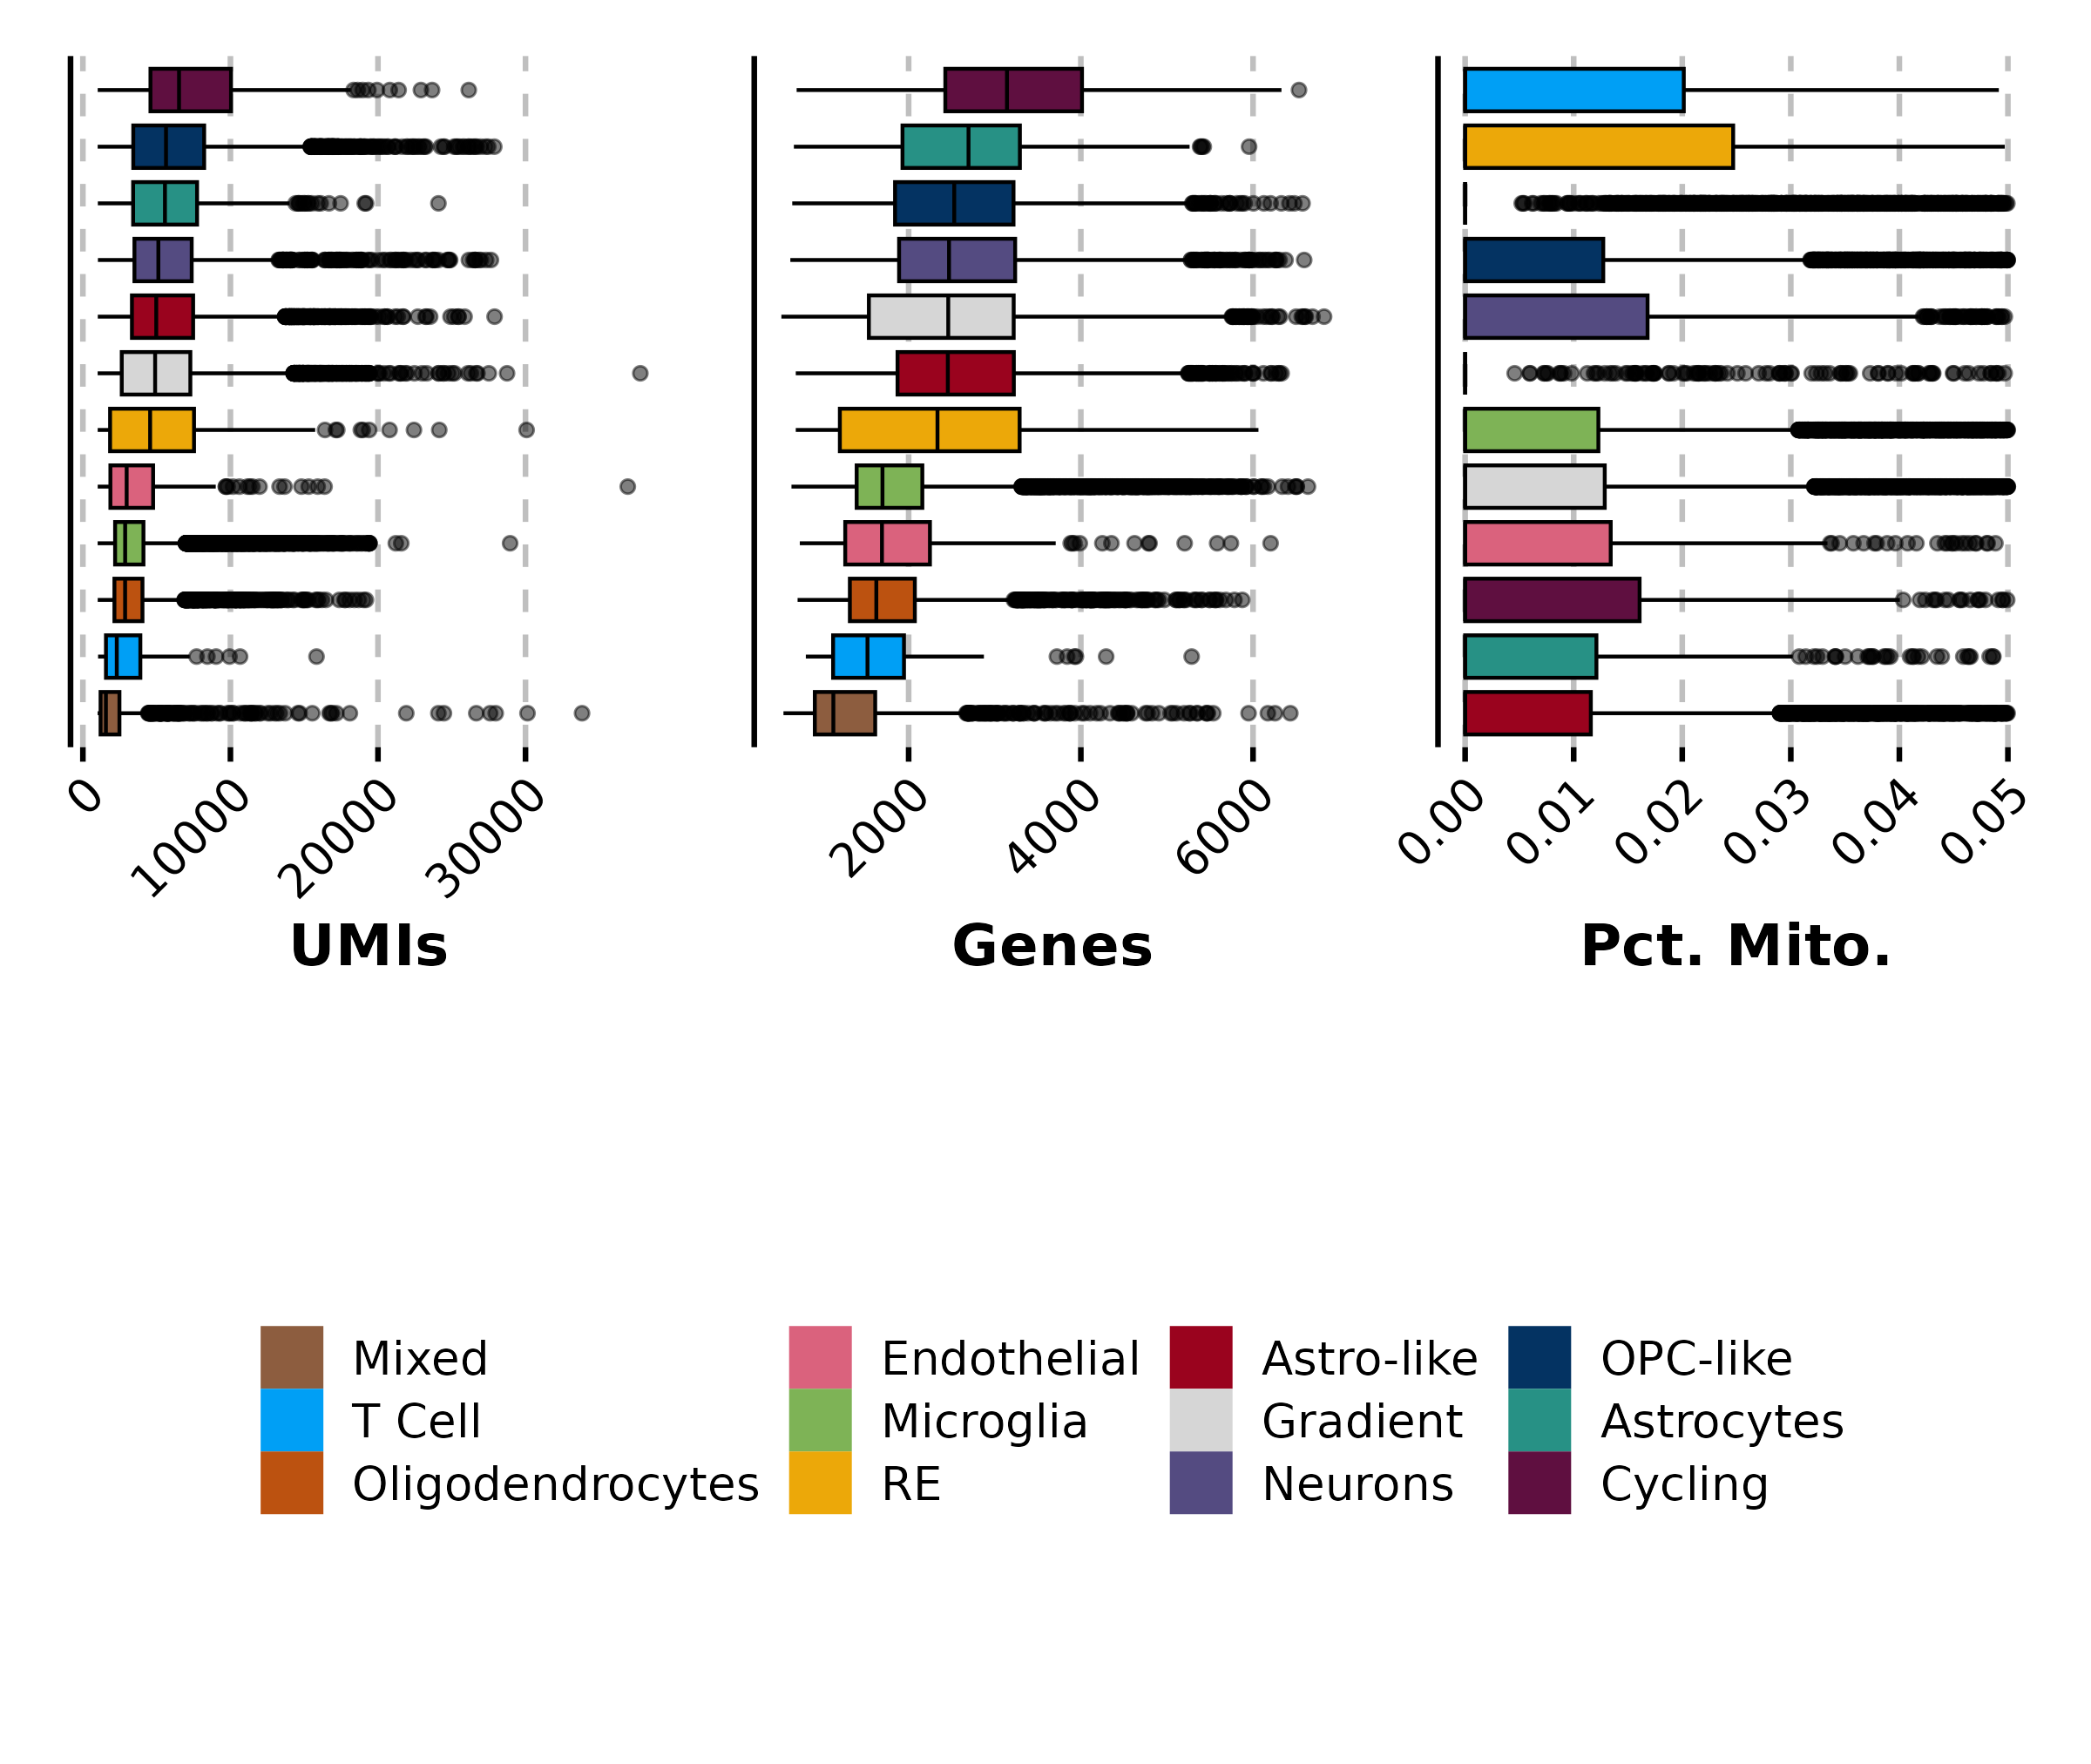
                         feature = "nCount_RNA", 
                         group.by = "relabelling", 
                         order = TRUE, 
                         colors.use = cluster_cols,
                         boxplot.linewidth = 0.5,
                         font.size = 16,
                         flip = TRUE) + 
       ggplot2::theme(axis.text.y = ggplot2::element_blank(),
                      axis.ticks.y = ggplot2::element_blank(),
                      axis.title.y = ggplot2::element_blank()) +
       ggplot2::labs(x = "",
                     y = "UMIs")

p2 <- SCpubr::do_BoxPlot(sample = sample, 
                         feature = "nFeature_RNA", 
                         group.by = "relabelling", 
                         order = TRUE, 
                         colors.use = cluster_cols,
                         boxplot.linewidth = 0.5,
                         font.size = 16,
                         flip = TRUE,
                         legend.position = "bottom",
                         legend.title = "") + 
       ggplot2::theme(axis.text.y = ggplot2::element_blank(),
                      axis.ticks.y = ggplot2::element_blank(),
                      axis.title.y = ggplot2::element_blank()) +
       ggplot2::labs(x = "",
                     y = "Genes")

p3 <- SCpubr::do_BoxPlot(sample = sample, 
                         feature = "percent.mt", 
                         group.by = "relabelling", 
                         order = TRUE, 
                         colors.use = cluster_cols,
                         boxplot.linewidth = 0.5,
                         font.size = 16,
                         flip = TRUE)+ 
       ggplot2::theme(axis.text.y = ggplot2::element_blank(),
                      axis.ticks.y = ggplot2::element_blank(),
                      axis.title.y = ggplot2::element_blank()) +
       ggplot2::labs(x = "",
                     y = "Pct. Mito.")

layout <- "ABC
           DDD"

p <- patchwork::wrap_plots(A = p1, B = p2, C = p3, D = patchwork::guide_area(), design = layout, guides = "collect")