scale.setup <- SCpubr:::compute_scales(sample = NULL,
feature = NULL,
assay = NULL,
reduction = NULL,
slot = NULL,
number.breaks = 5,
min.cutoff = NA,
max.cutoff = NA,
flavor = "Seurat",
enforce_symmetry = FALSE,
from_data = TRUE,
limits.use = c(1, 4))
p <- data %>%
ggplot2::ggplot(mapping = ggplot2::aes(y = forcats::fct_rev(.data$Pair),
x = .data$Type,
fill = .data$Score)) +
ggplot2::geom_tile(color = "white", linewidth = 0.25, na.rm = TRUE) +
ggplot2::scale_y_discrete(expand = c(0, 0), position = "right") +
ggplot2::scale_x_discrete(expand = c(0, 0),
position = "top") +
ggplot2::guides(x.sec = SCpubr:::guide_axis_label_trans(~paste0(levels(.data$Pair))),
y.sec = SCpubr:::guide_axis_label_trans(~paste0(levels(.data$Type)))) +
ggplot2::coord_equal() +
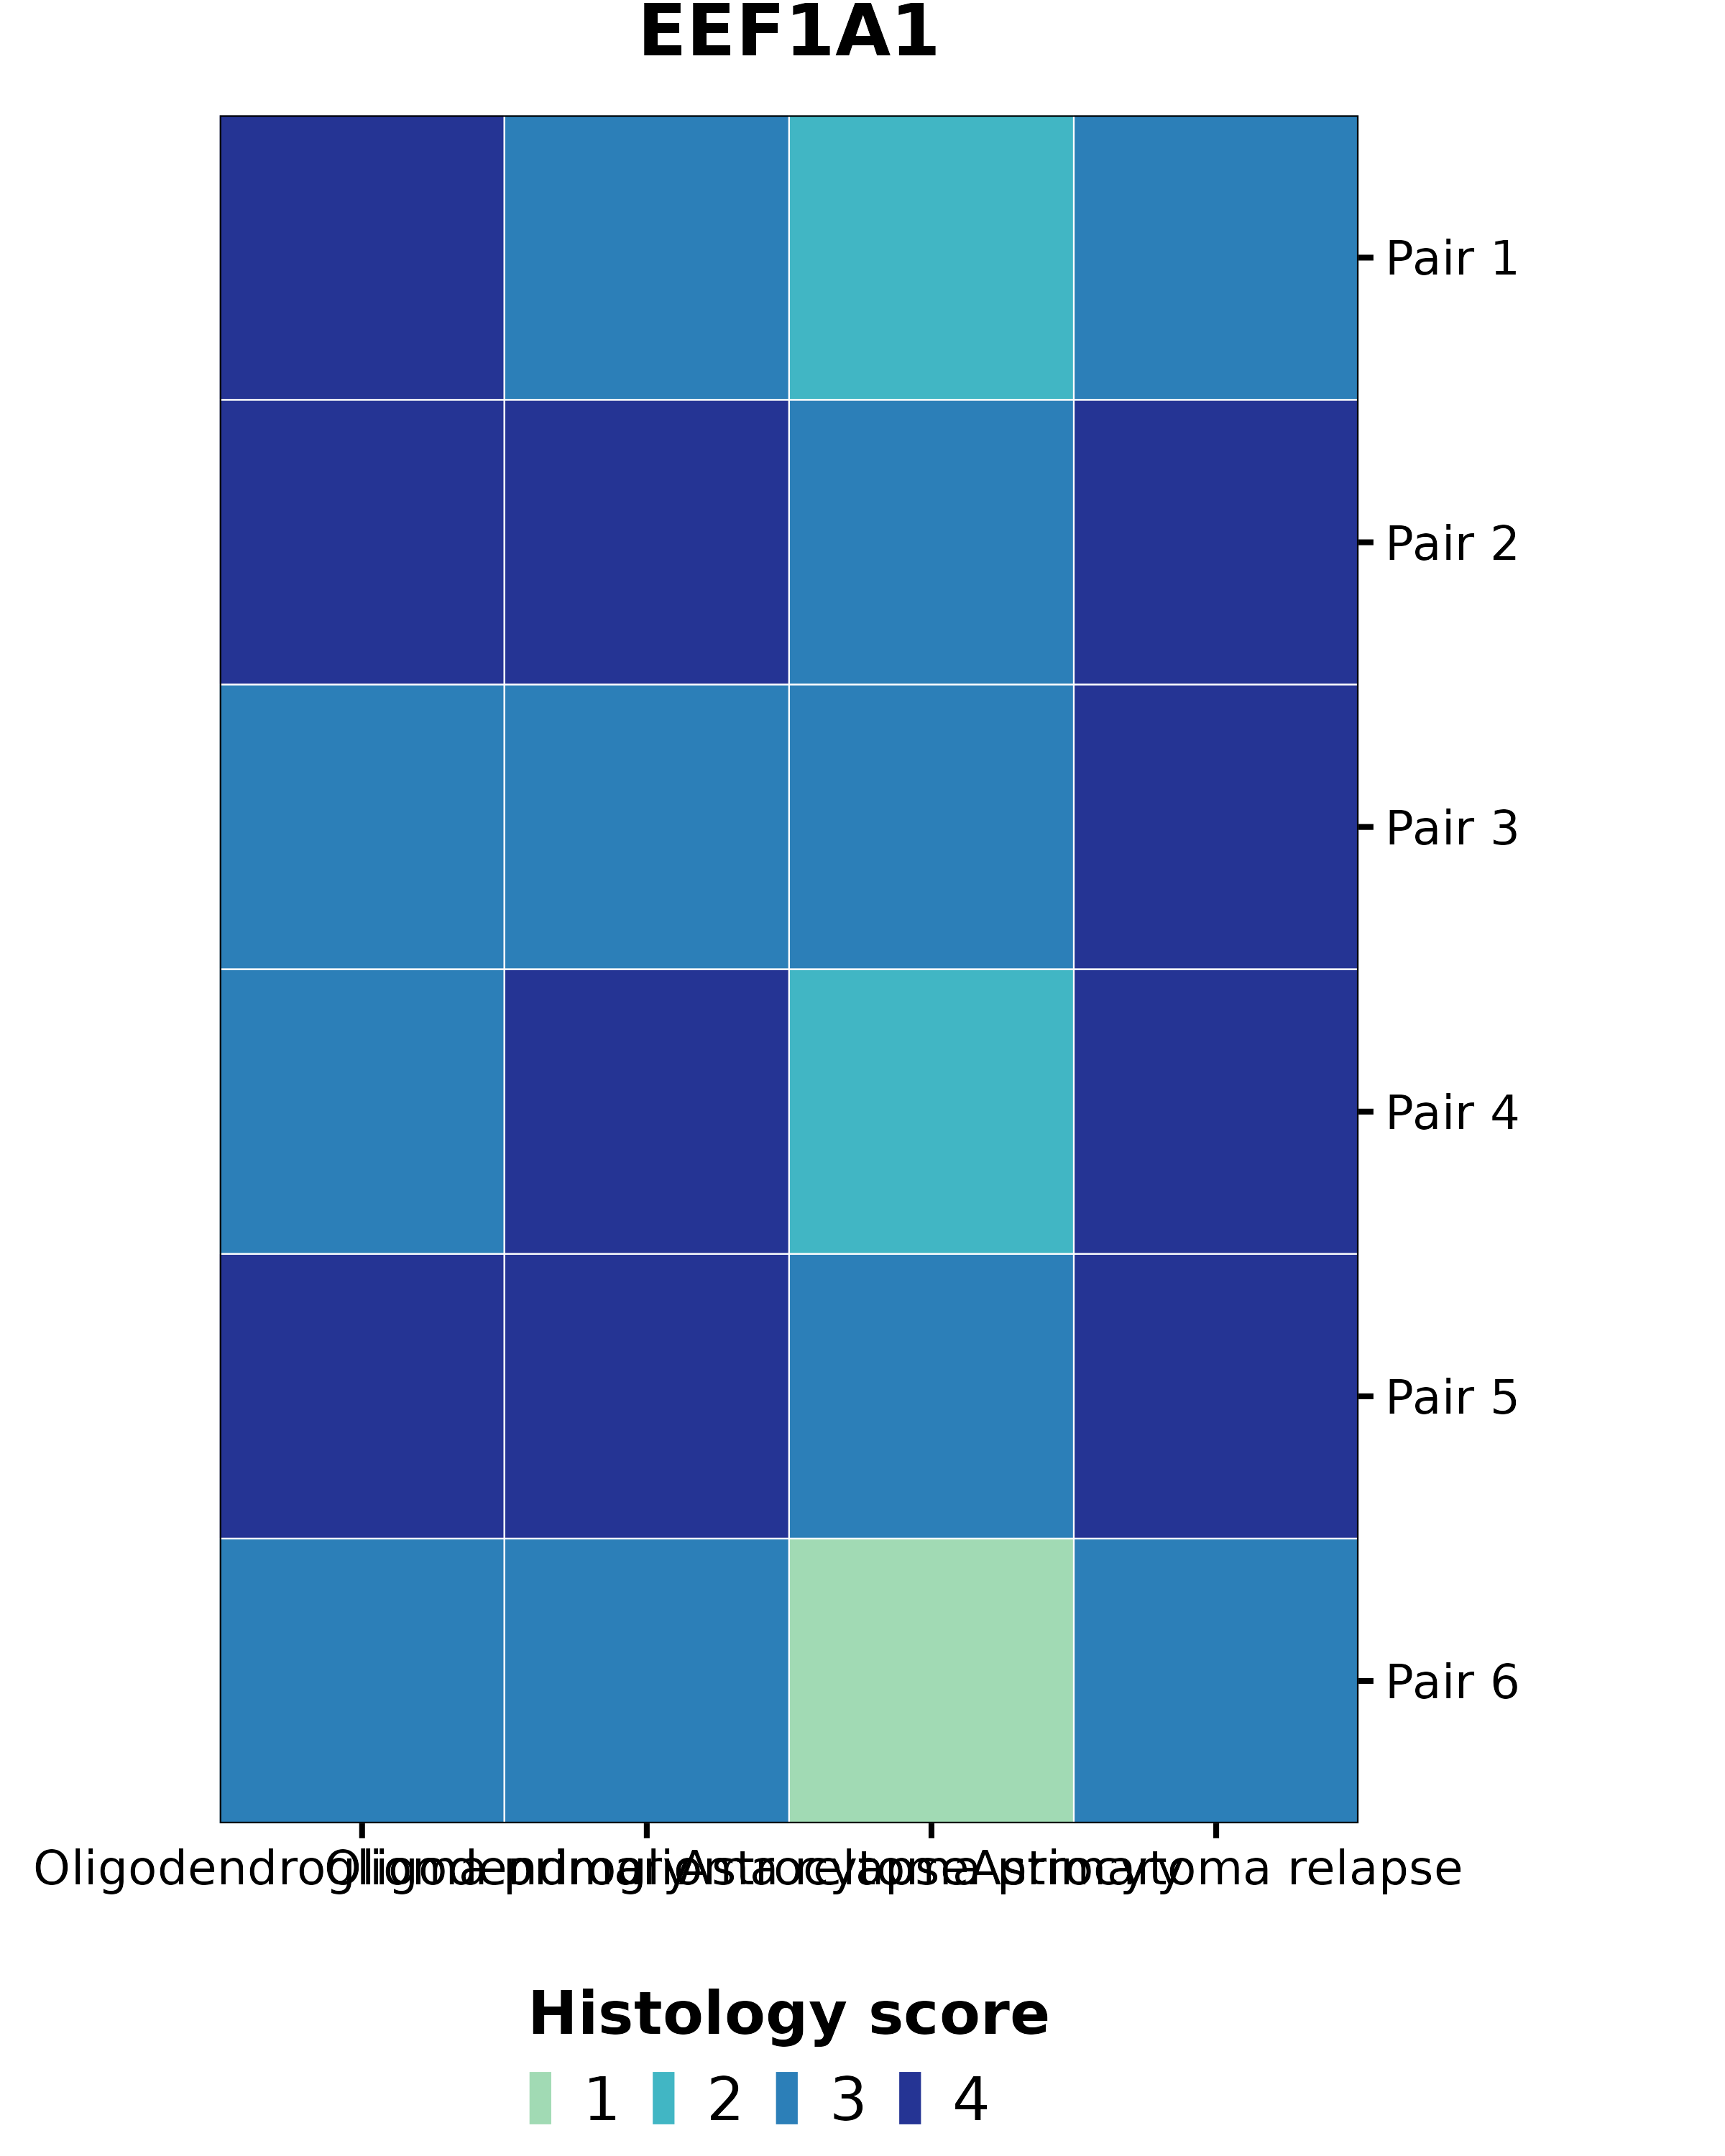
ggplot2::scale_fill_manual(values = stats::setNames(RColorBrewer::brewer.pal(n = 5, "YlGnBu")[c(2, 3, 4, 5)], c("1", "2", "3", "4"))) +
ggplot2::guides("fill" = ggplot2::guide_legend(title = "Histology score",
title.position = "top",
title.hjust = 0.5))
p <- p +
ggplot2::labs(title = "EEF1A1") +
ggplot2::theme_minimal(base_size = 20) +
ggplot2::theme(axis.ticks.x.bottom = ggplot2::element_line(color = "black"),
axis.ticks.x.top = ggplot2::element_blank(),
axis.ticks.y.left = ggplot2::element_blank(),
axis.ticks.y.right = ggplot2::element_line(color = "black"),
axis.text.y.left = ggplot2::element_blank(),
axis.text.y.right = ggplot2::element_text(color = "black"),
axis.text.x.top = ggplot2::element_blank(),
axis.text.x.bottom = ggplot2::element_text(color = "black"),
axis.title.x.bottom = ggplot2::element_text(color = "black"),
axis.title.x.top = ggplot2::element_blank(),
axis.title.y.right = ggplot2::element_blank(),
axis.title.y.left = ggplot2::element_blank(),
axis.line = ggplot2::element_blank(),
plot.title = ggplot2::element_text(face = "bold", hjust = 0.5),
plot.subtitle = ggplot2::element_text(hjust = 0),
plot.caption = ggplot2::element_text(hjust = 1),
panel.grid = ggplot2::element_blank(),
panel.grid.minor.y = ggplot2::element_line(color = "white", linewidth = 0.1),
text = ggplot2::element_text(family = "sans"),
plot.caption.position = "plot",
legend.title = ggplot2::element_text(face = "bold", size = 20),
legend.text = ggplot2::element_text(size = 20),
legend.justification = "center",
legend.key.size = ggplot2::unit(0.3, 'cm'),
plot.margin = ggplot2::margin(t = 1, r = 10, b = 0, l = 10),
panel.border = ggplot2::element_rect(fill = NA, color = "black", linewidth = 0.5),
panel.grid.major = ggplot2::element_blank(),
legend.position = "bottom",
plot.background = ggplot2::element_rect(fill = "white", color = "white"),
panel.background = ggplot2::element_rect(fill = "white", color = "white"),
legend.background = ggplot2::element_rect(fill = "white", color = "white"))