Figure S1H

Code
# Enrique Blanco Carmona
# e.blancocarmona@kitz-heidelberg.de
# PhD Student – Clinical Bioinformatics
# Division of Pediatric Neurooncology (B062)
# DKFZ-KiTZ | Germany

sample <- readRDS("/omics/odcf/analysis/OE0145_projects/idh_gliomas/Figures_Science/revision/IDH_gliomas_book/datasets/Gradient_subset_AS_primary.rds")
markers <- readRDS("/omics/odcf/analysis/OE0145_projects/idh_gliomas/Figures_Science/revision/IDH_gliomas_book/datasets/IDH_gliomas_TB_annotation_kit_with_Suva_programs.rds")

sample$Clusters <- sample$seurat_clusters
Code
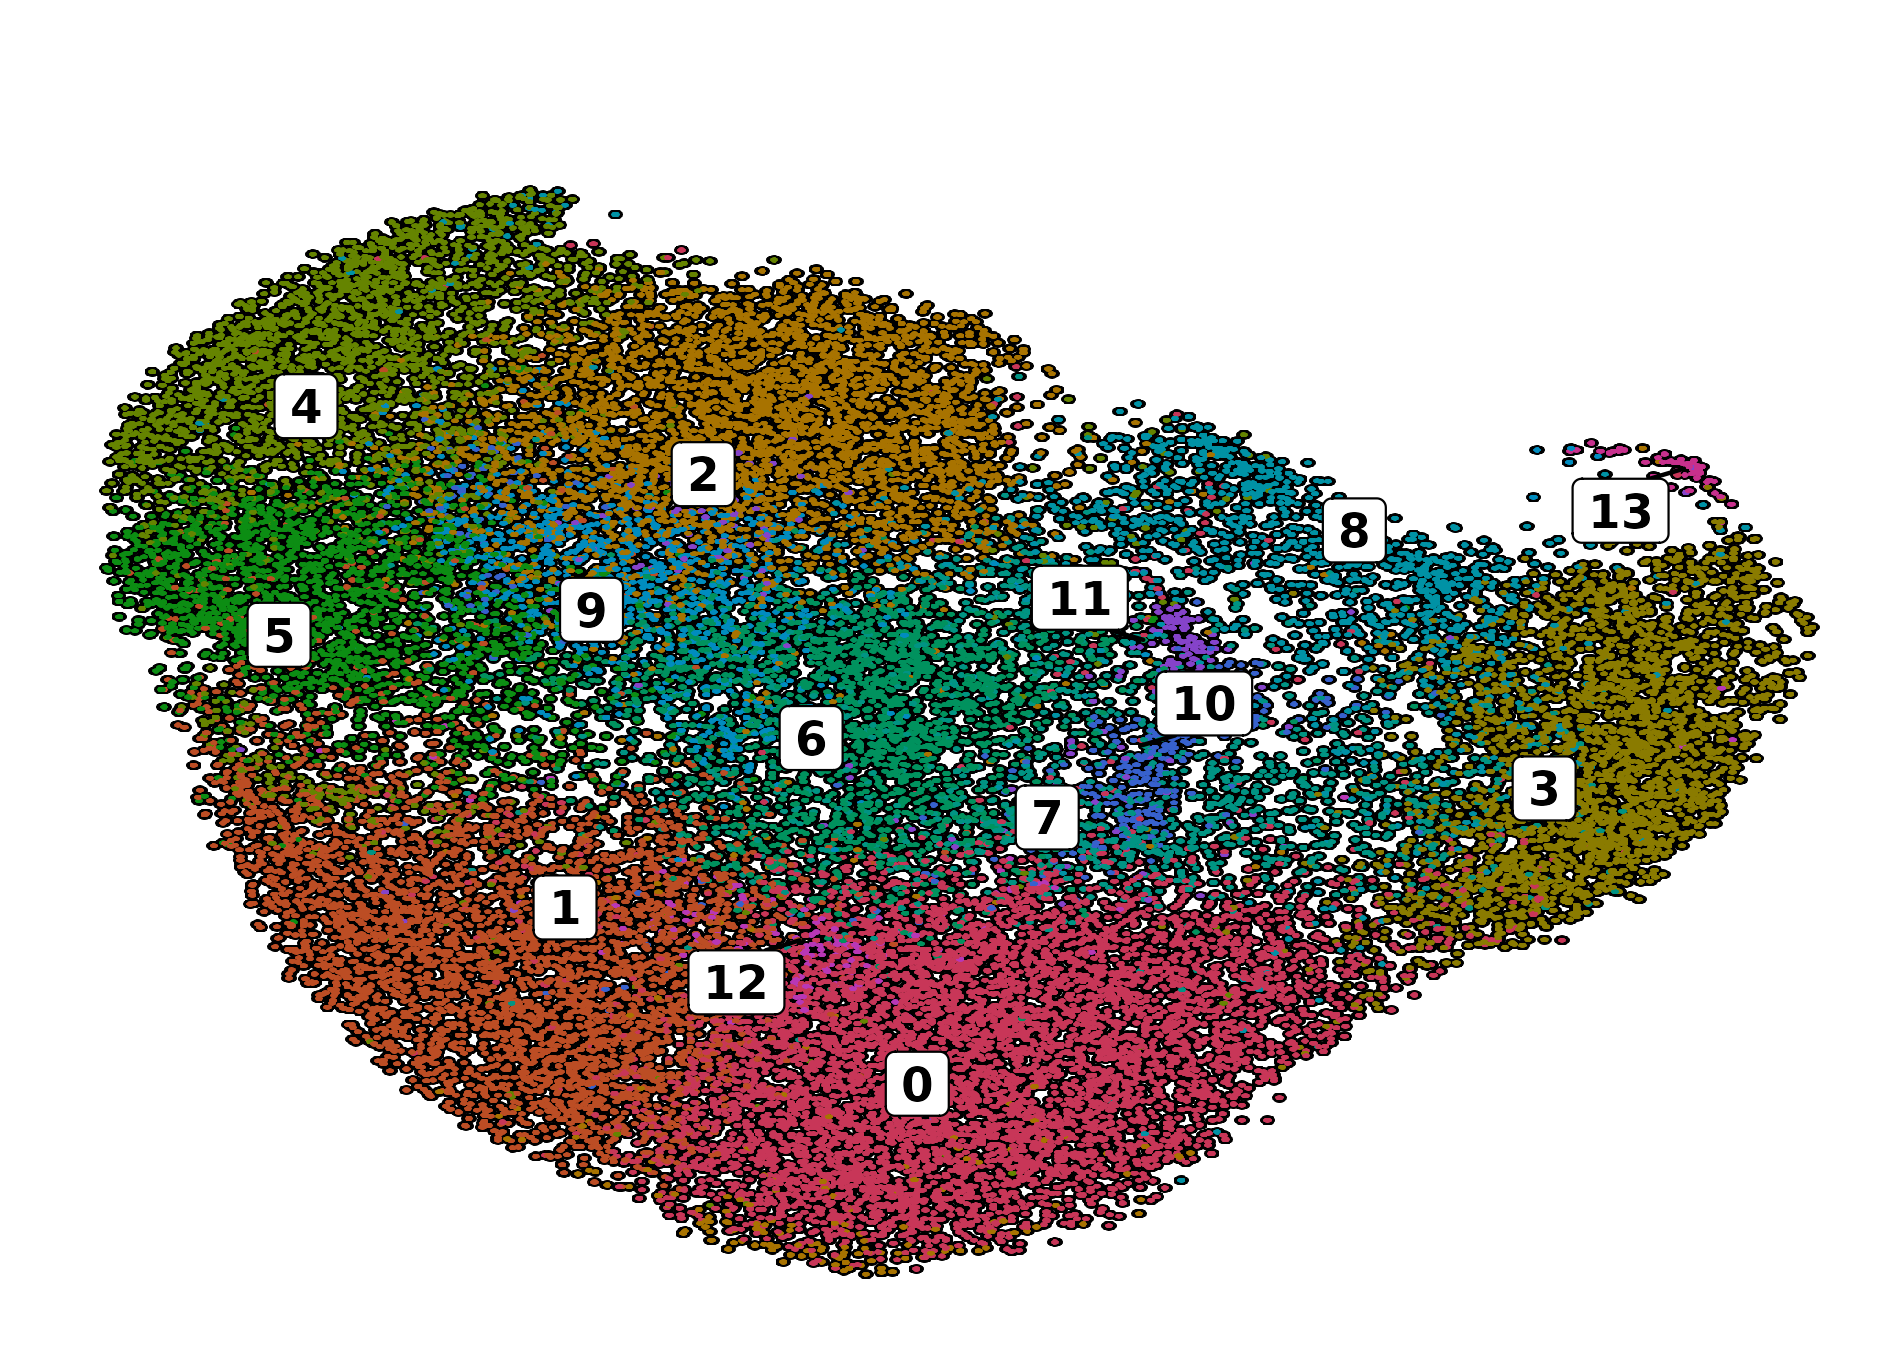
p1 <- SCpubr::do_DimPlot(sample = sample,
                         group.by = "seurat_clusters",
                         font.size = 20,
                         raster = TRUE,
                         raster.dpi = 2048,
                         pt.size = 4,
                         legend.icon.size = 8,
                         legend.ncol = 2,
                         label = TRUE,
                         repel = TRUE,
                         legend.position = "none")

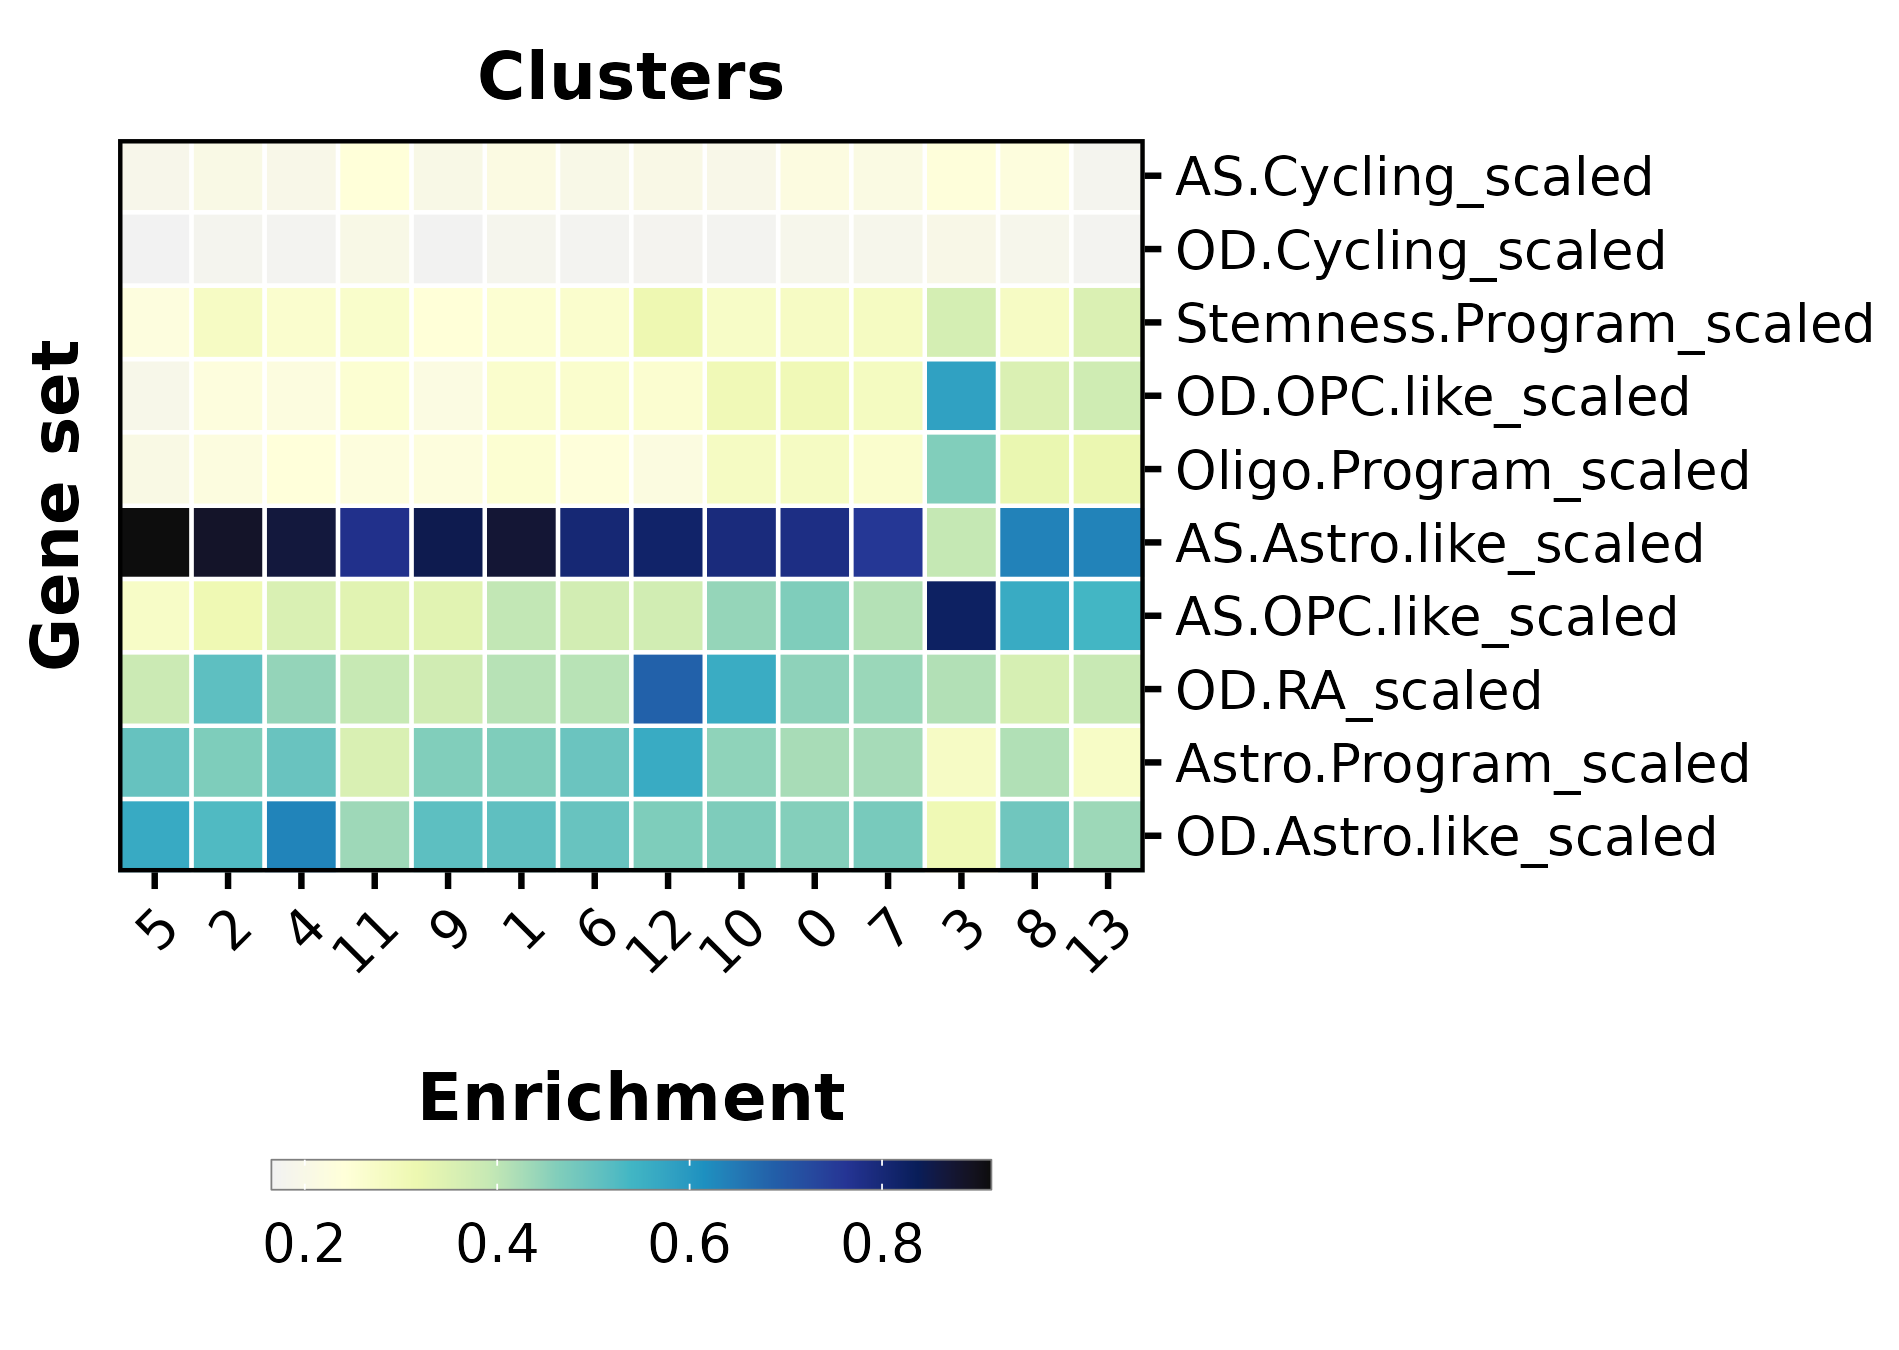
p2 <- SCpubr::do_EnrichmentHeatmap(sample = sample,
                                   font.size = 16,
                                   input_gene_list = markers,
                                   group.by = "seurat_clusters",
                                   flip = TRUE,
                                   axis.text.face = "plain",
                                   legend.length = 12,
                                   legend.width = 0.5,
                                   legend.framecolor = "grey50",
                                   legend.tickcolor = "white",
                                   legend.framewidth = 0.2,
                                   legend.tickwidth = 0.2) + 
      ggplot2::labs(x = "Clusters", y = "Gene set")