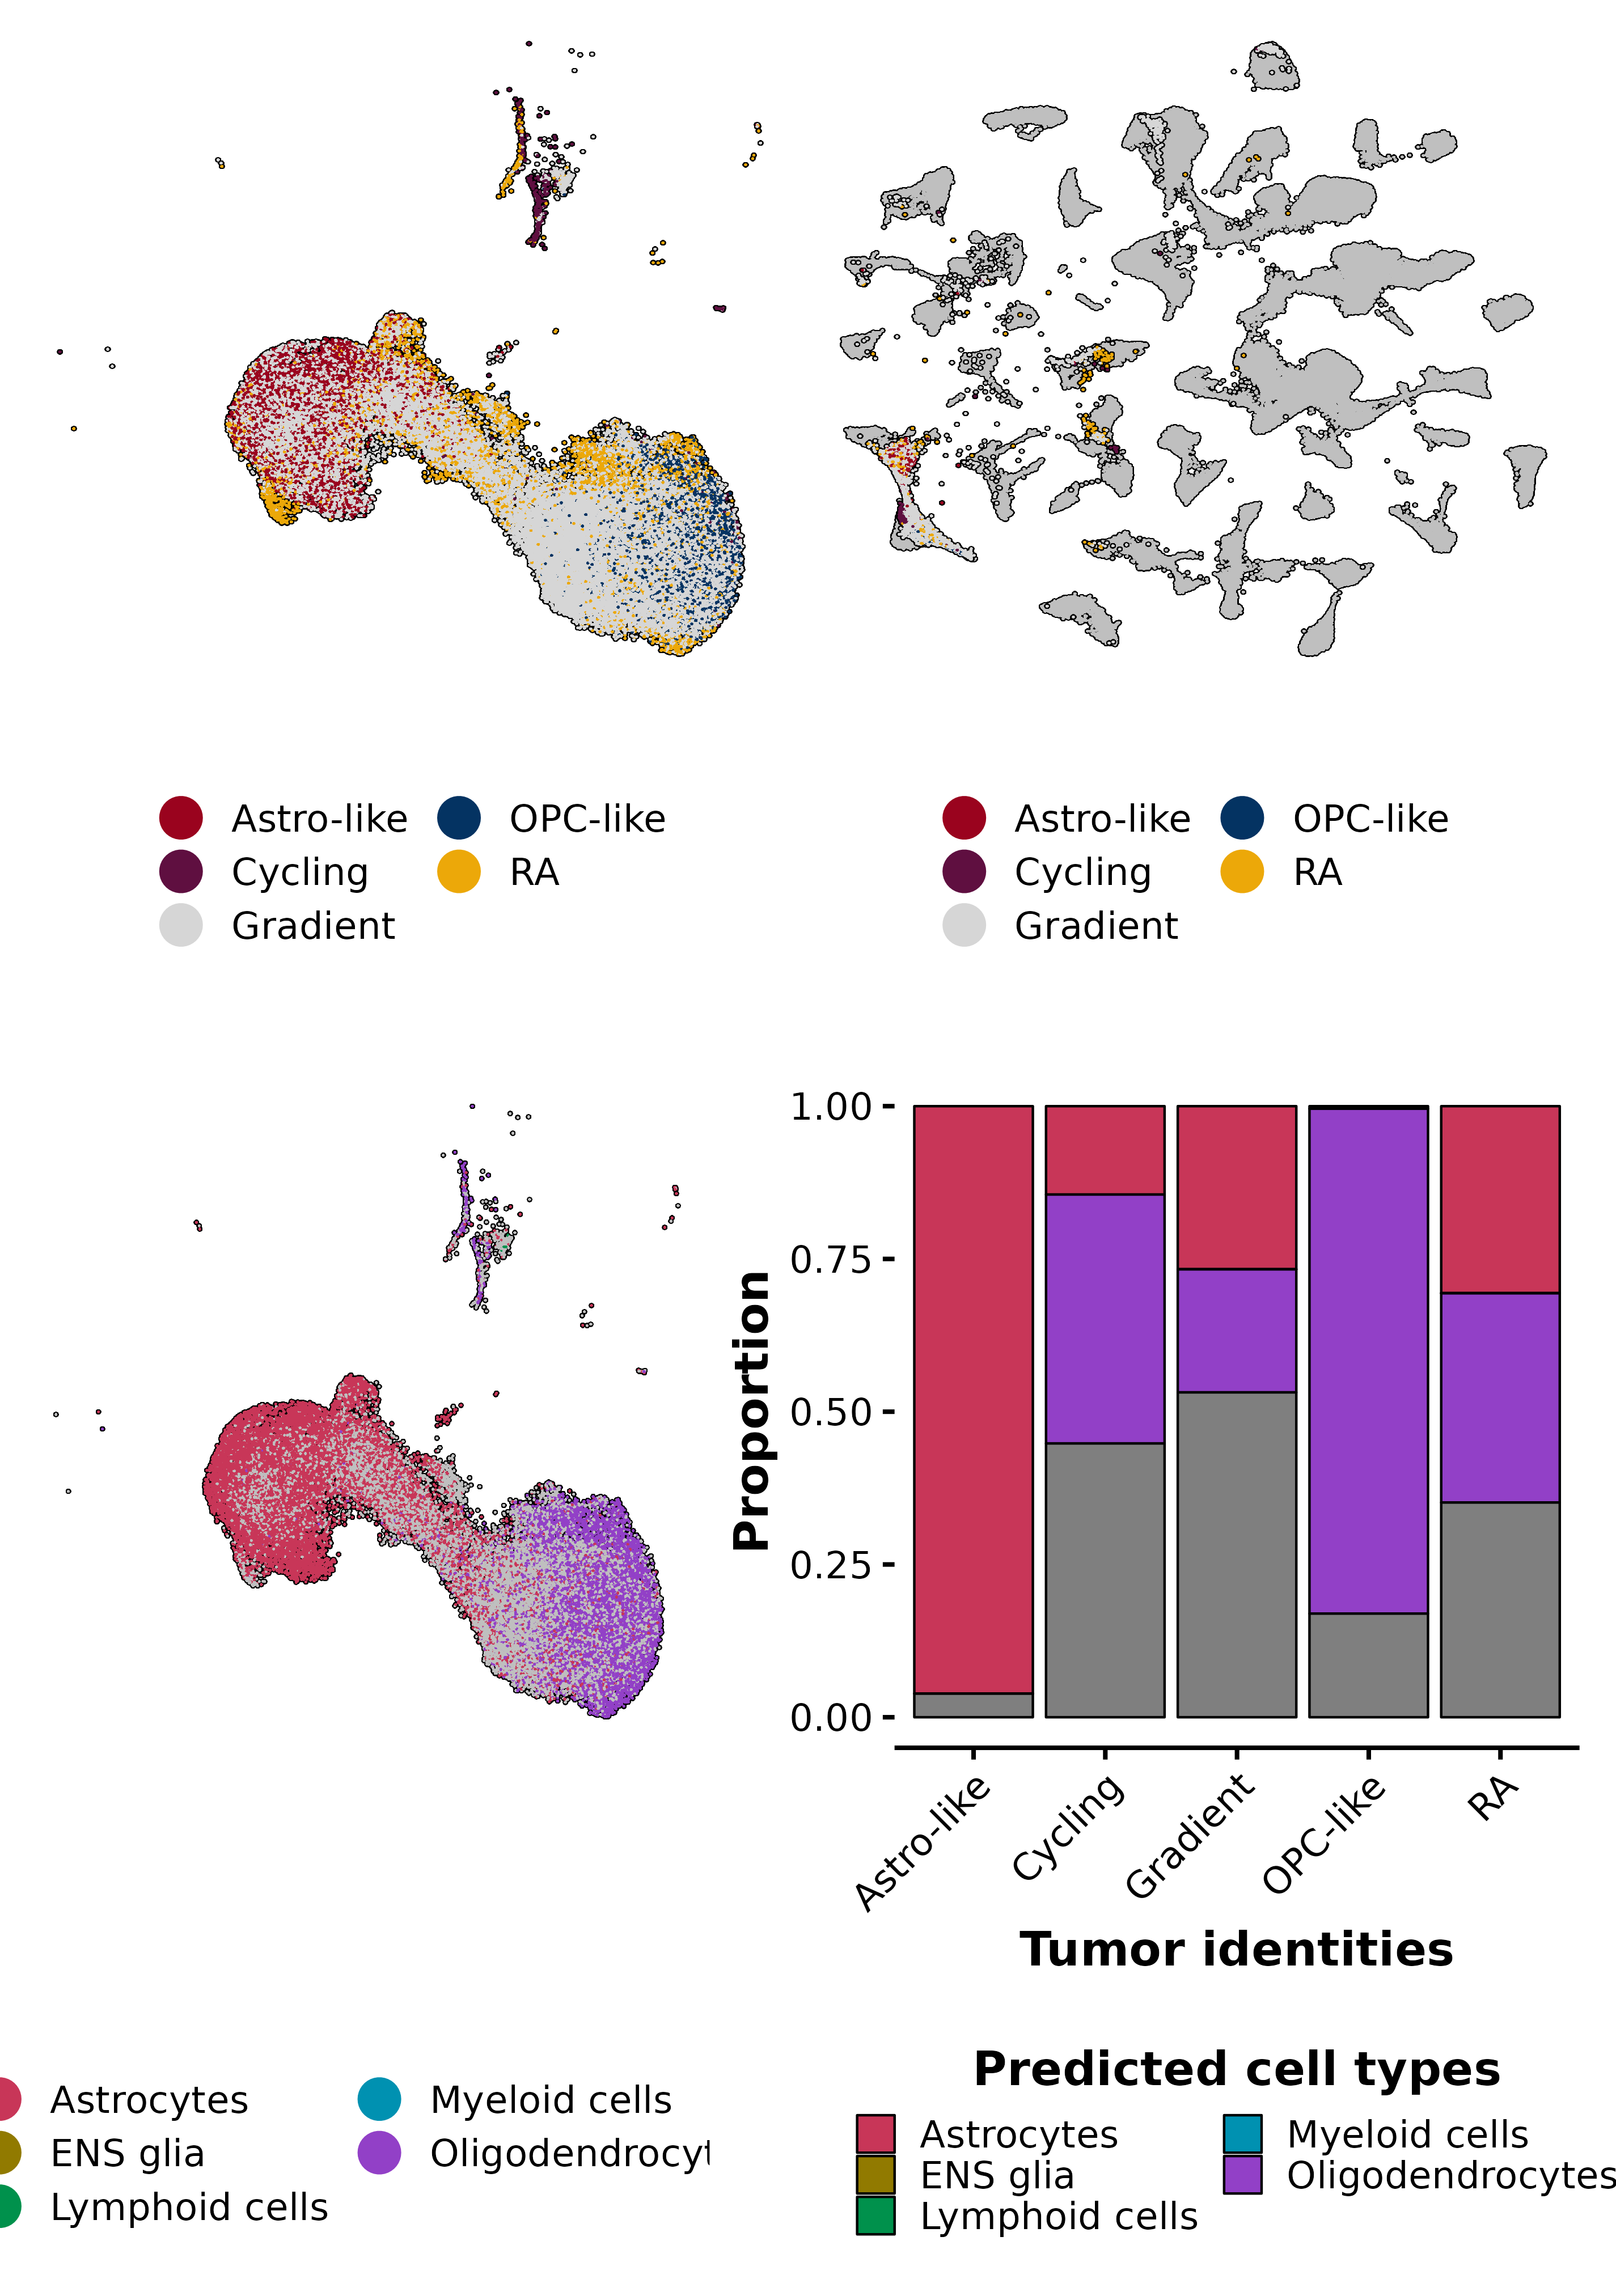
p1 <- SCpubr::do_DimPlot(sample = sample,
                         reduction = "umap",
                         colors.use = cluster_cols,
                         raster = TRUE,
                         raster.dpi = 2048,
                         pt.size = 4,
                         legend.icon.size = 8,
                         legend.ncol = 2,
                         font.size = 20)

p2 <- SCpubr::do_DimPlot(sample = sample,
                         reduction = "ref.umap",
                         colors.use = cluster_cols,
                         raster = TRUE,
                         raster.dpi = 2048,
                         pt.size = 4,
                         legend.icon.size = 8,
                         legend.ncol = 2,
                         font.size = 20)

# Add reference coordinates.
data <- as.data.frame(fetusref@reductions$refUMAP@cell.embeddings)
colnames(data) <- c("x", "y")

base_layer <- scattermore::geom_scattermore(data = data,
                                            mapping = ggplot2::aes(x = .data$x,
                                                                   y = .data$y),
                                            color = "grey75",
                                            size = 4,
                                            stroke = 4 / 2,
                                            show.legend = FALSE,
                                            pointsize = 4,
                                            pixels = c(2048, 2048))
p2$layers <- append(base_layer, p2$layers)

base_layer <- scattermore::geom_scattermore(data = data,
                                            mapping = ggplot2::aes(x = .data$x,
                                                                   y = .data$y),
                                            color = "black",
                                            size = 4 * 2,
                                            stroke = 4 / 2,
                                            show.legend = FALSE,
                                            pointsize = 4 * 2,
                                            pixels = c(2048, 2048))
p2$layers <- append(base_layer, p2$layers)

p3 <- SCpubr::do_DimPlot(sample = sample,
                         reduction = "umap",
                         group.by = "inferred_annotation",
                         raster = TRUE,
                         raster.dpi = 2048,
                         pt.size = 4,
                         legend.icon.size = 8,
                         legend.ncol = 2,
                         font.size = 20)

p4 <- SCpubr::do_BarPlot(sample = sample,
                         group.by = "inferred_annotation",
                         split.by = "relabelling",
                         position = "fill",
                         legend.title = "Predicted cell types",
                         font.size = 20,
                         axis.text.face = "plain",
                         legend.ncol = 2) +
      ggplot2::xlab("Tumor identities")

p <- (p1 | p2) / (p3 | p4)
