Figure 2B

Code
# Enrique Blanco Carmona
# e.blancocarmona@kitz-heidelberg.de
# PhD Student – Clinical Bioinformatics
# Division of Pediatric Neurooncology (B062)
# DKFZ-KiTZ | Germany


# Read in sample.
sample <- readRDS("/omics/odcf/analysis/OE0145_projects/idh_gliomas/Figures_Science/revision/IDH_gliomas_book/datasets/integrated_LGGs.rds")

# Subset for the tumor cells.
sample <- sample[, sample$relabelling %in% c("Astro-like", "RA", "OPC-like", "Gradient", "Cycling")]
sample$relabelling[sample$relabelling == "RA"] <- "RE"
sample$subtype[sample$subtype == "Oligodendroglioma"] <- "OD"
sample$subtype[sample$subtype == "Astrocytoma"] <- "AS"
sample$subtype = factor(sample$subtype, levels = c("OD", "AS"))
# Read in pathway activities.
progeny_activities <- readRDS("/omics/odcf/analysis/OE0145_projects/idh_gliomas/Figures_Science/revision/IDH_gliomas_book/datasets/primary_progeny.rds")
Code
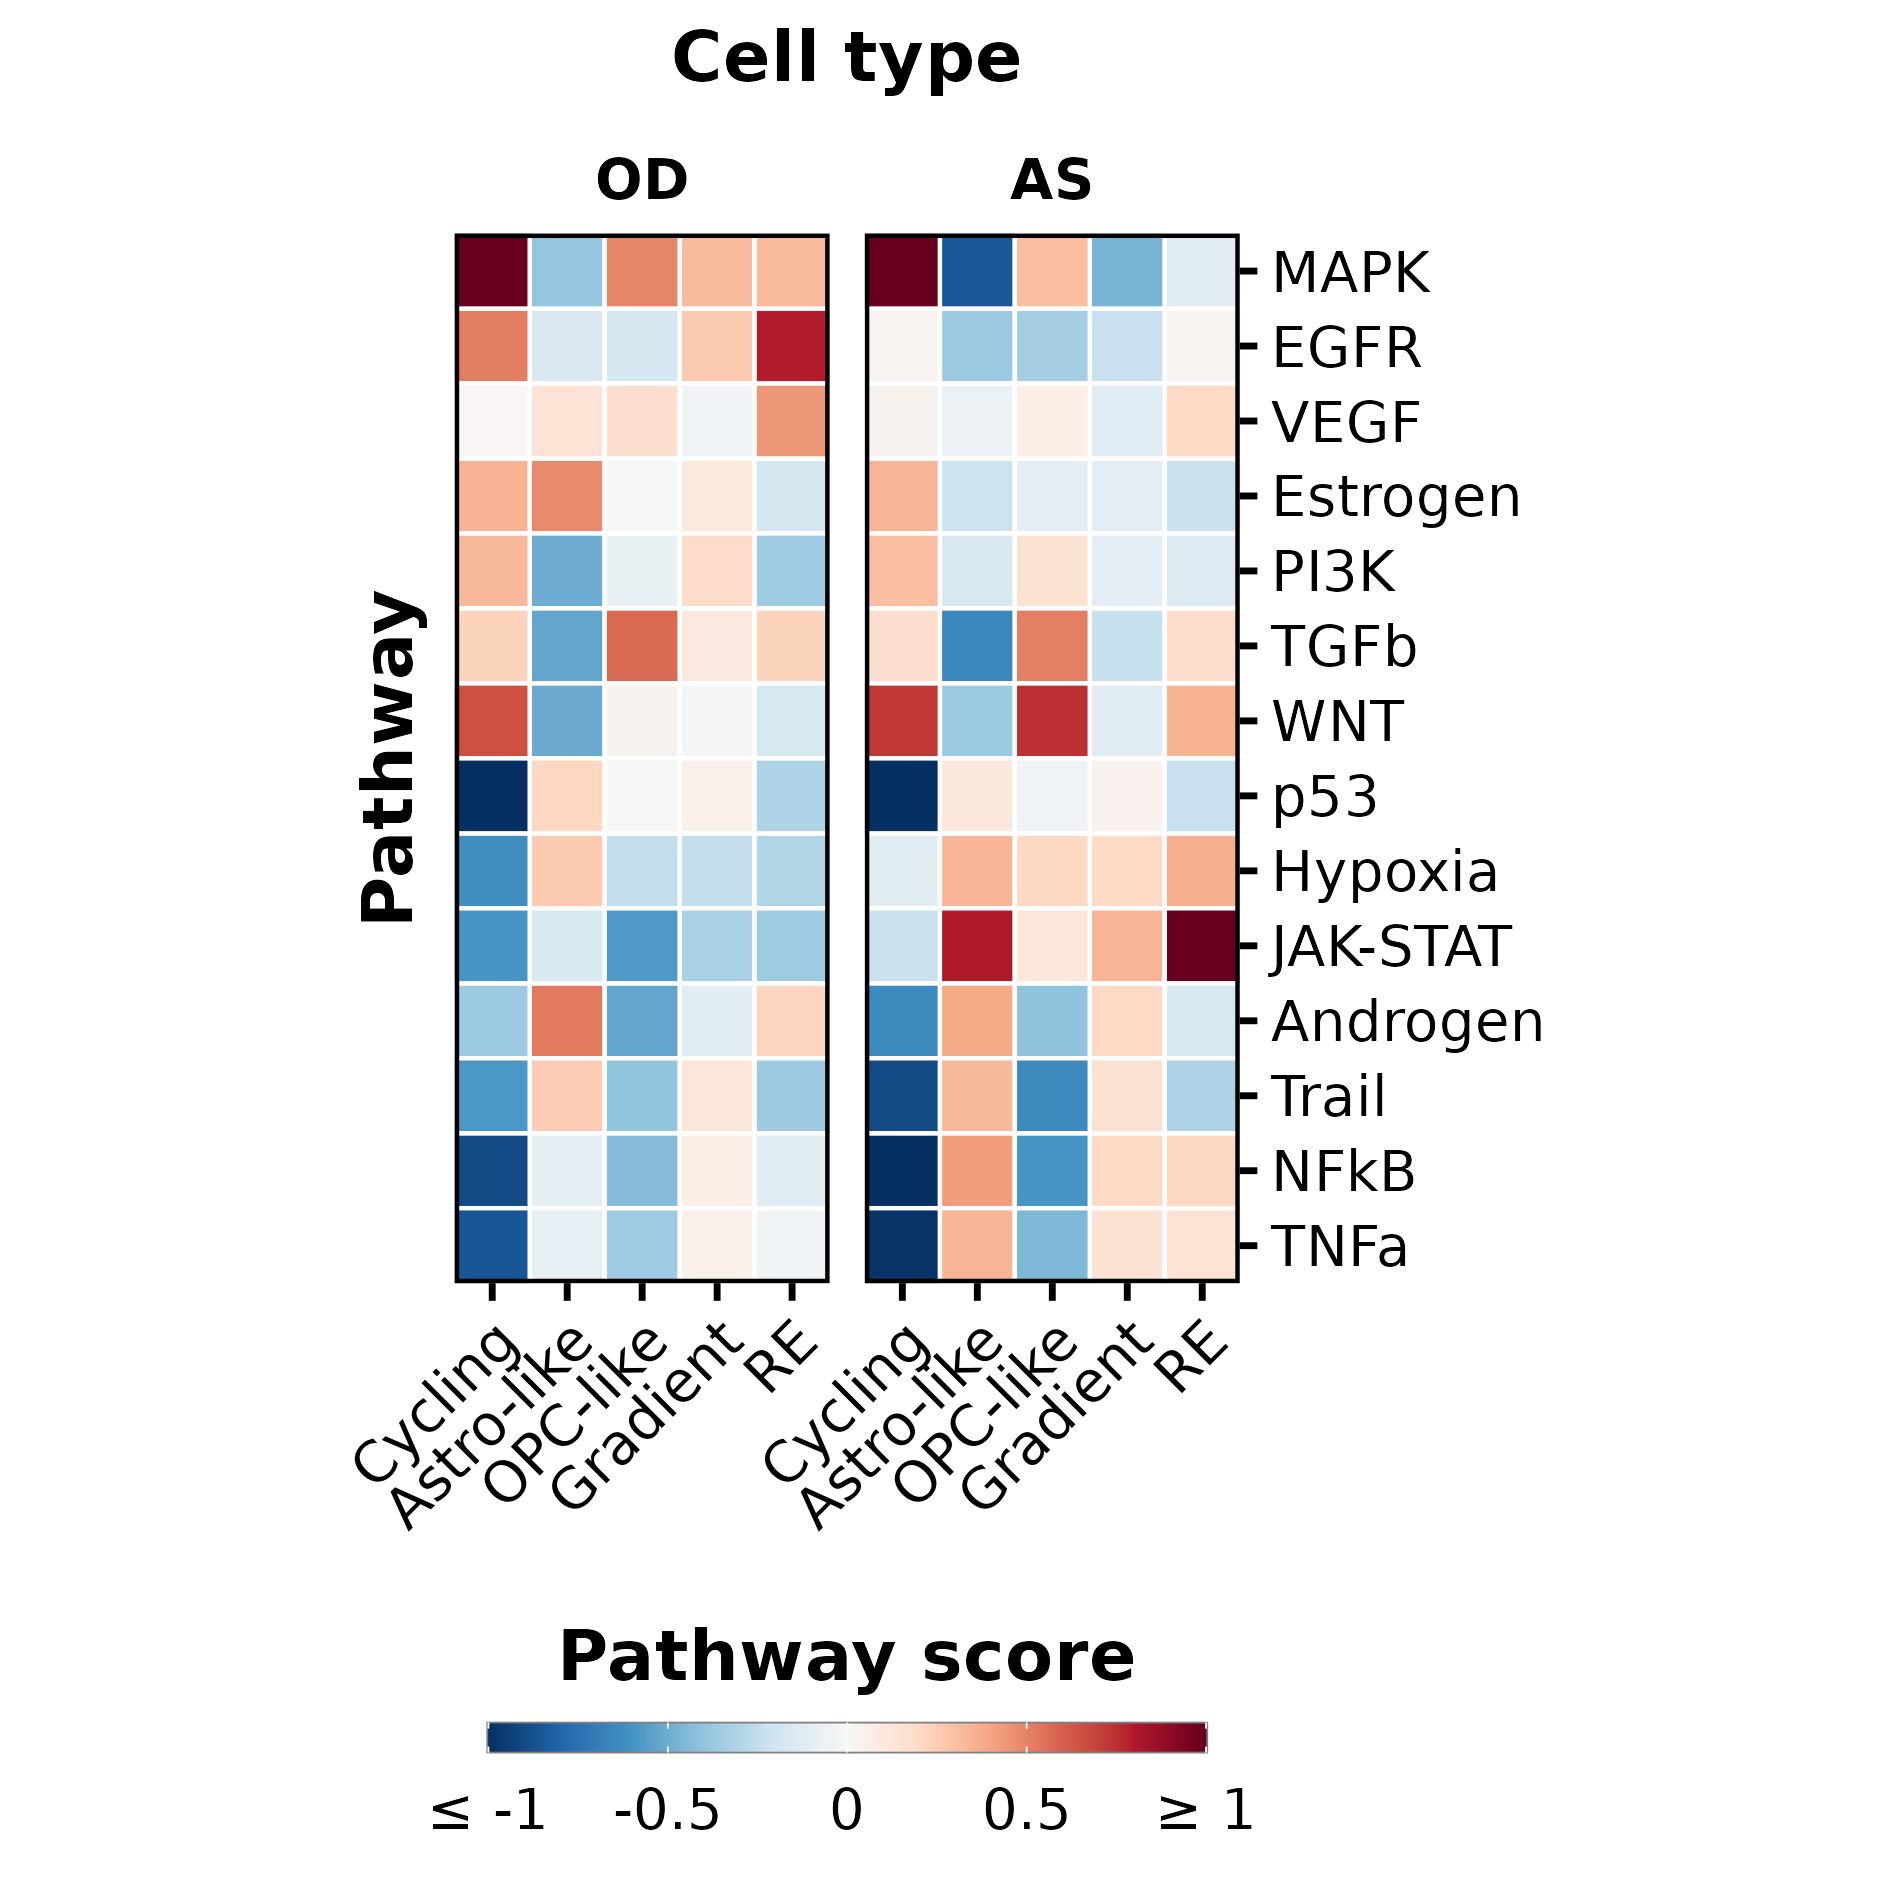
p <- SCpubr::do_PathwayActivityPlot(sample = sample,
                                    activities = progeny_activities,
                                    slot = "scale.data",
                                    split.by = "subtype",
                                    group.by = c("relabelling"),
                                    min.cutoff = -1,
                                    max.cutoff = 1,
                                    flip = TRUE,
                                    font.size = 17,
                                    axis.text.face = "plain",
                                    legend.length = 12,
                                    legend.width = 0.5,
                                    legend.framecolor = "grey50",
                                    legend.tickcolor = "white",
                                    legend.framewidth = 0.2,
                                    legend.tickwidth = 0.2) + 
     ggplot2::ylab("Pathway") +
     ggplot2::xlab("Cell type")

p$guides$fill$title <- "Pathway score"
p <- p + ggplot2::theme(plot.margin = ggplot2::margin(t = 0, r = 0, b = 0, l = 0))